Layout, data visualisation and image editing for the annual market outlook of Credit Suisse.
Turning a year of global market forecasts into 66 calm, readable pages.
The brief
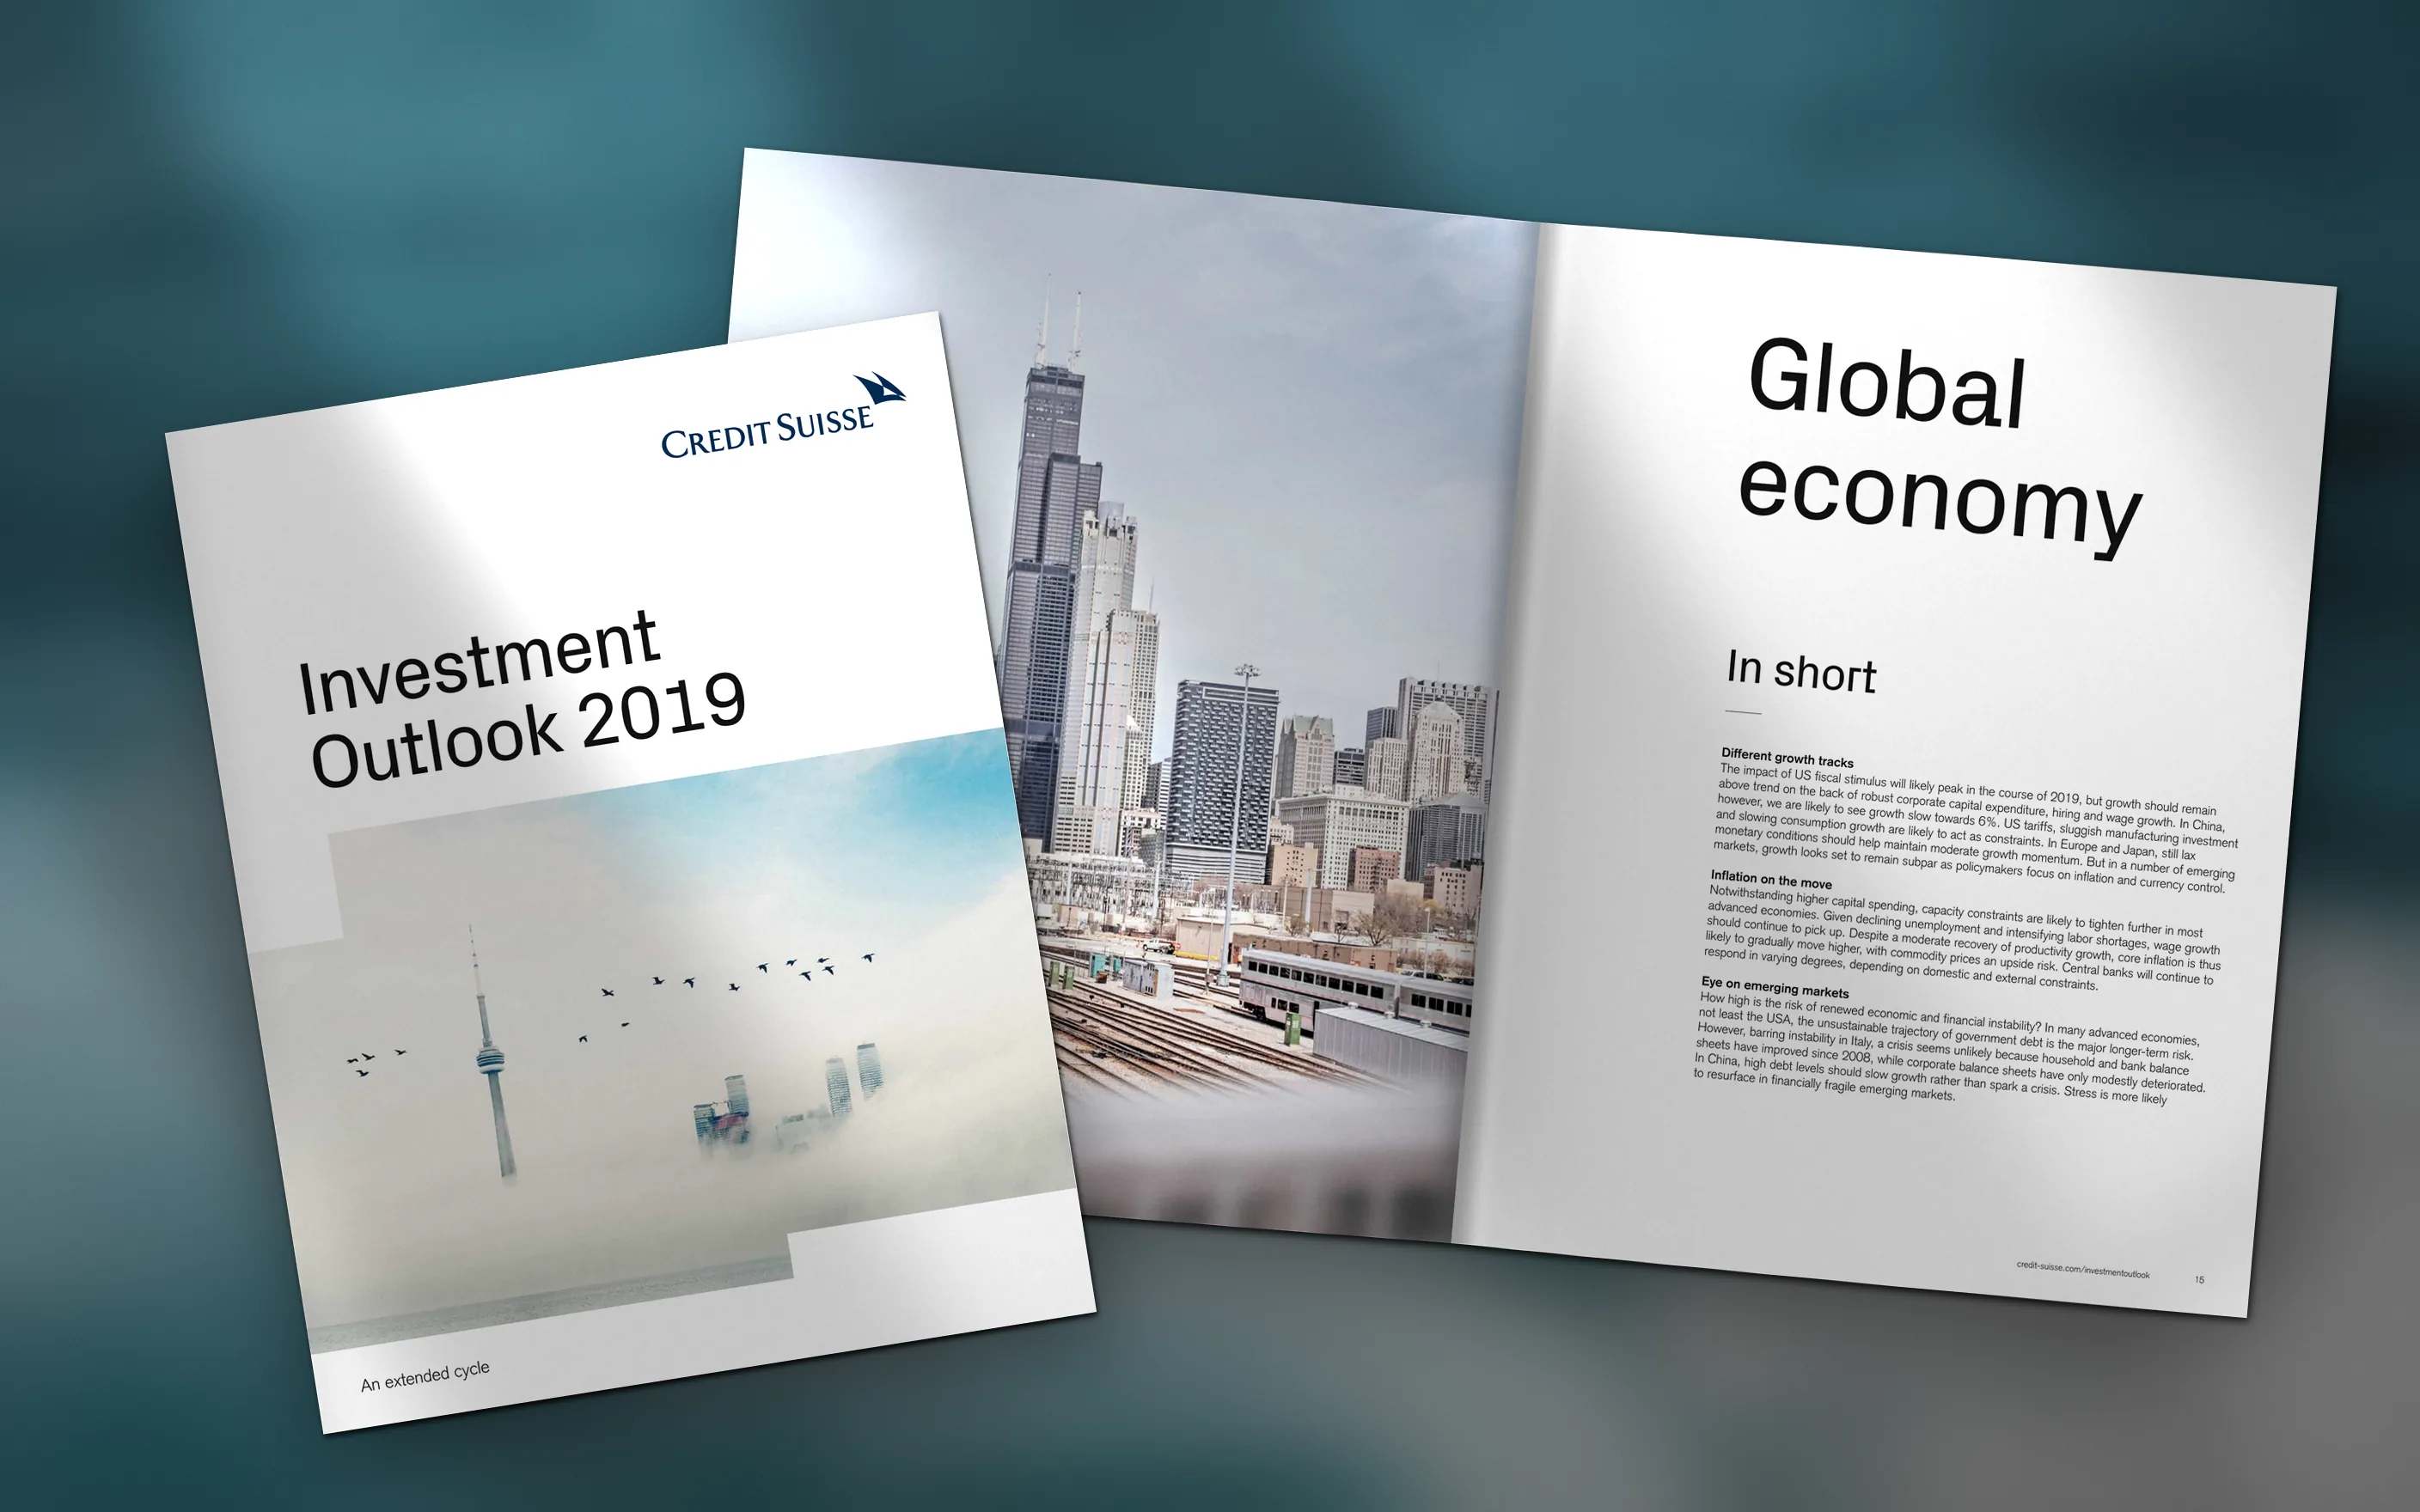
The Investment Outlook is the annual publication in which Credit Suisse shares its House View: forecasts for the global economy and financial markets, written for shareholders, clients and the press. Credit Suisse was the largest client of LINE Communications in Zurich. Shortly after joining the agency, I took over as lead designer and project manager for the 2019 edition.
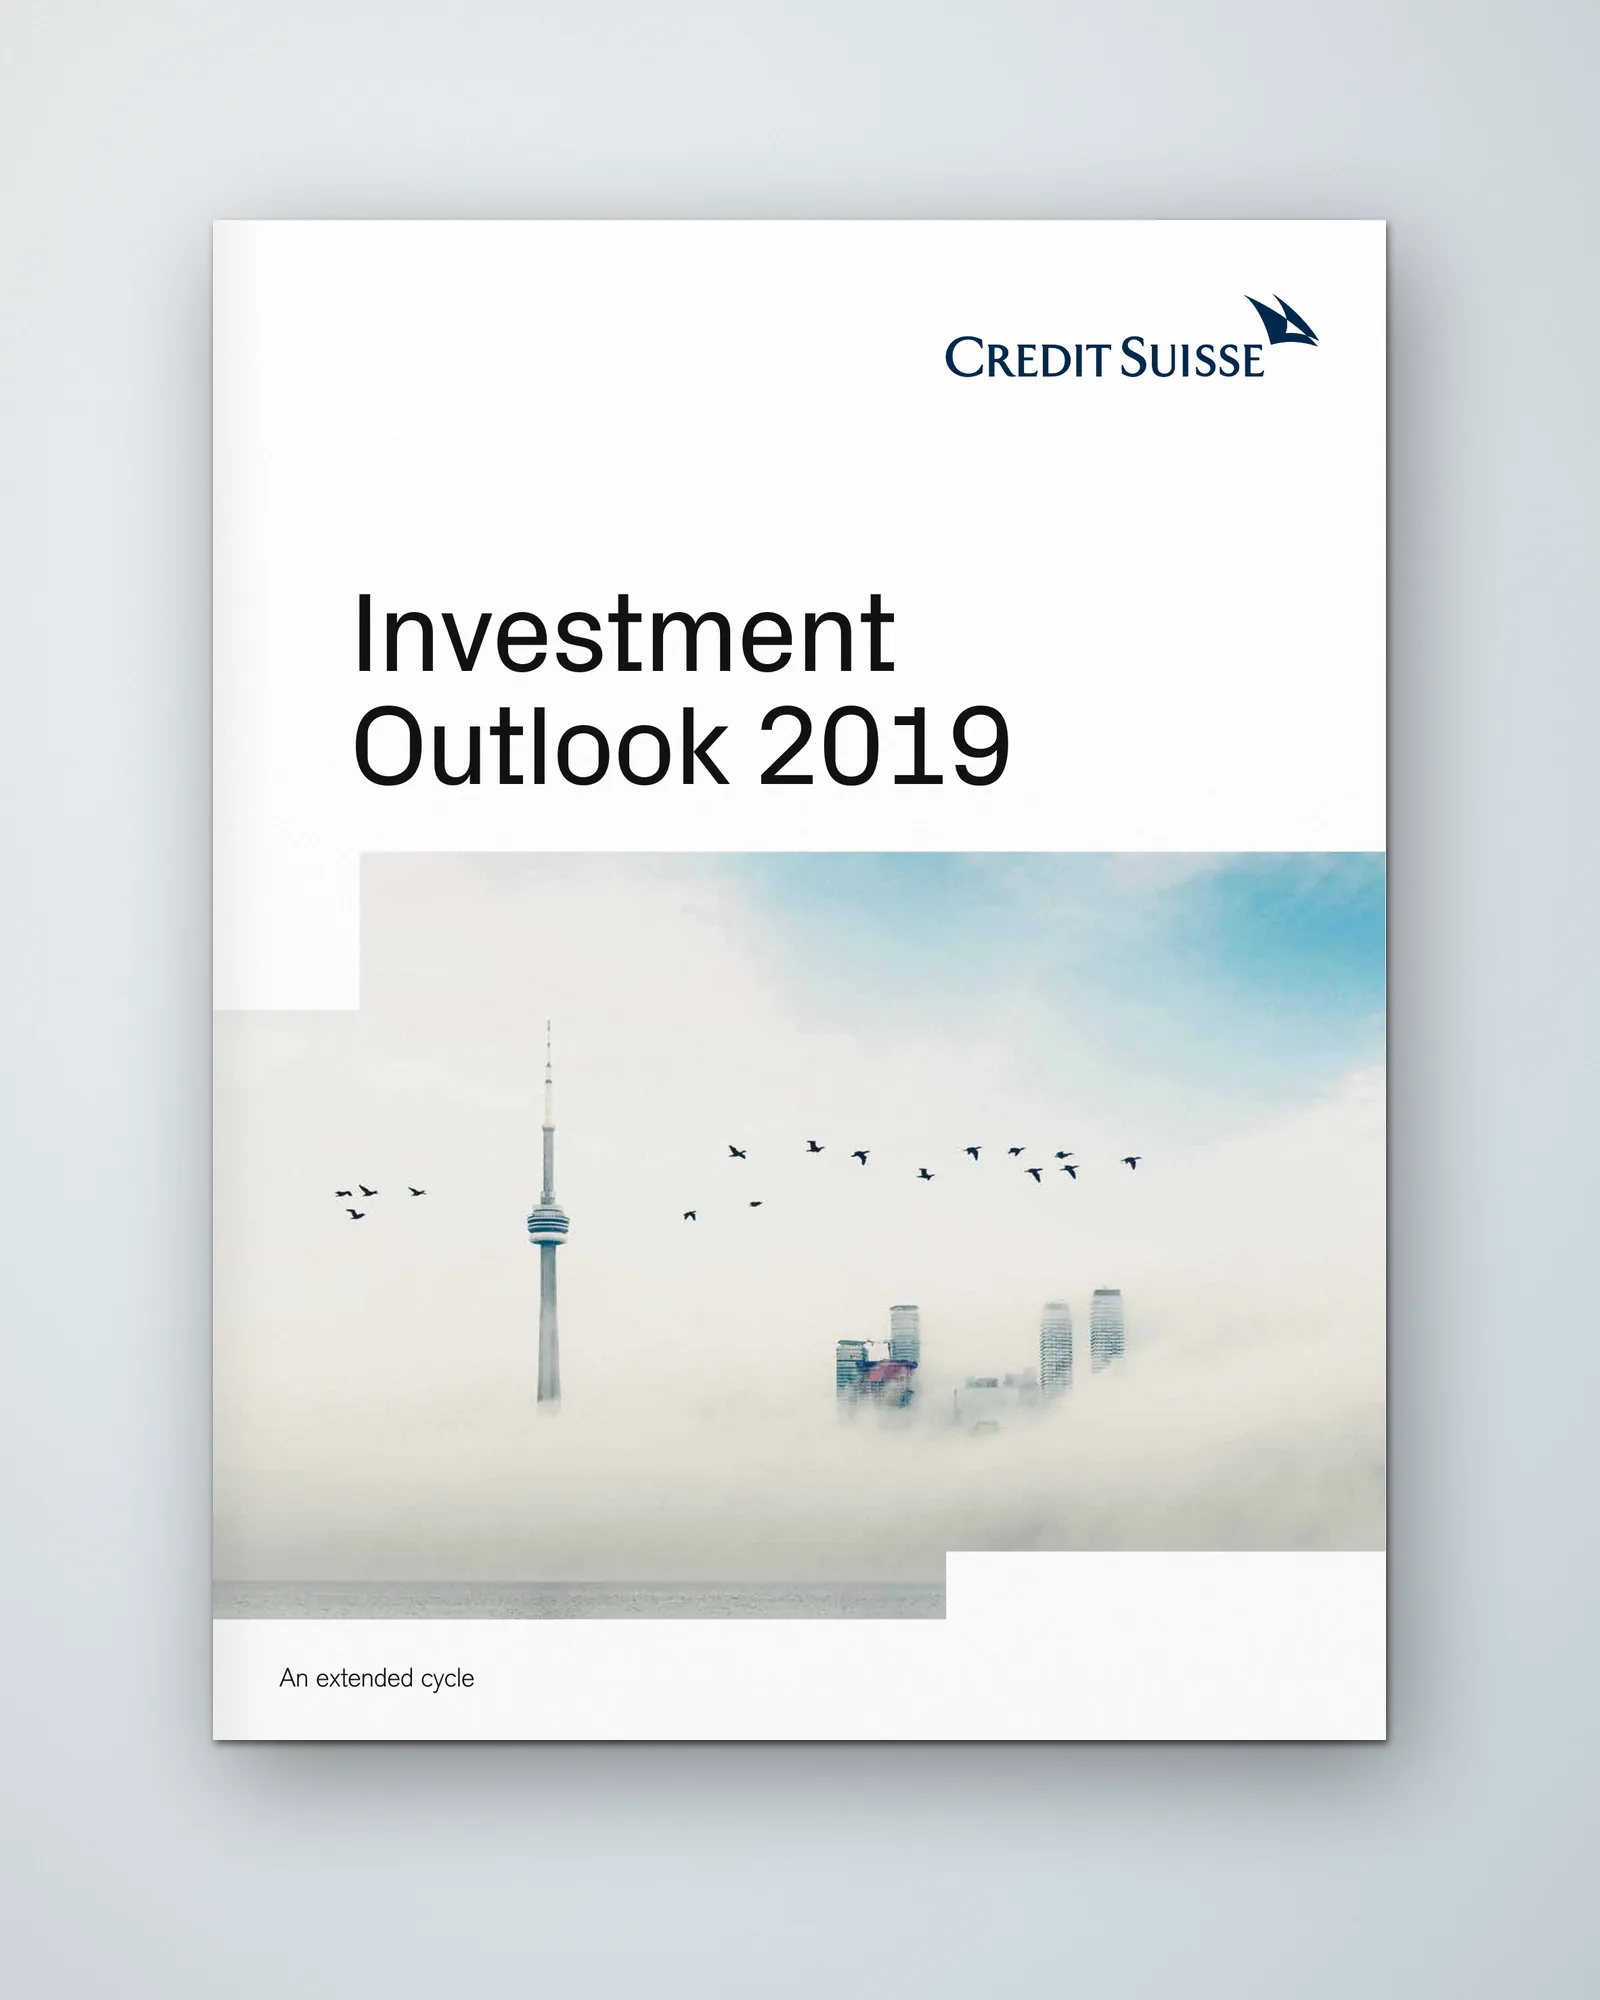
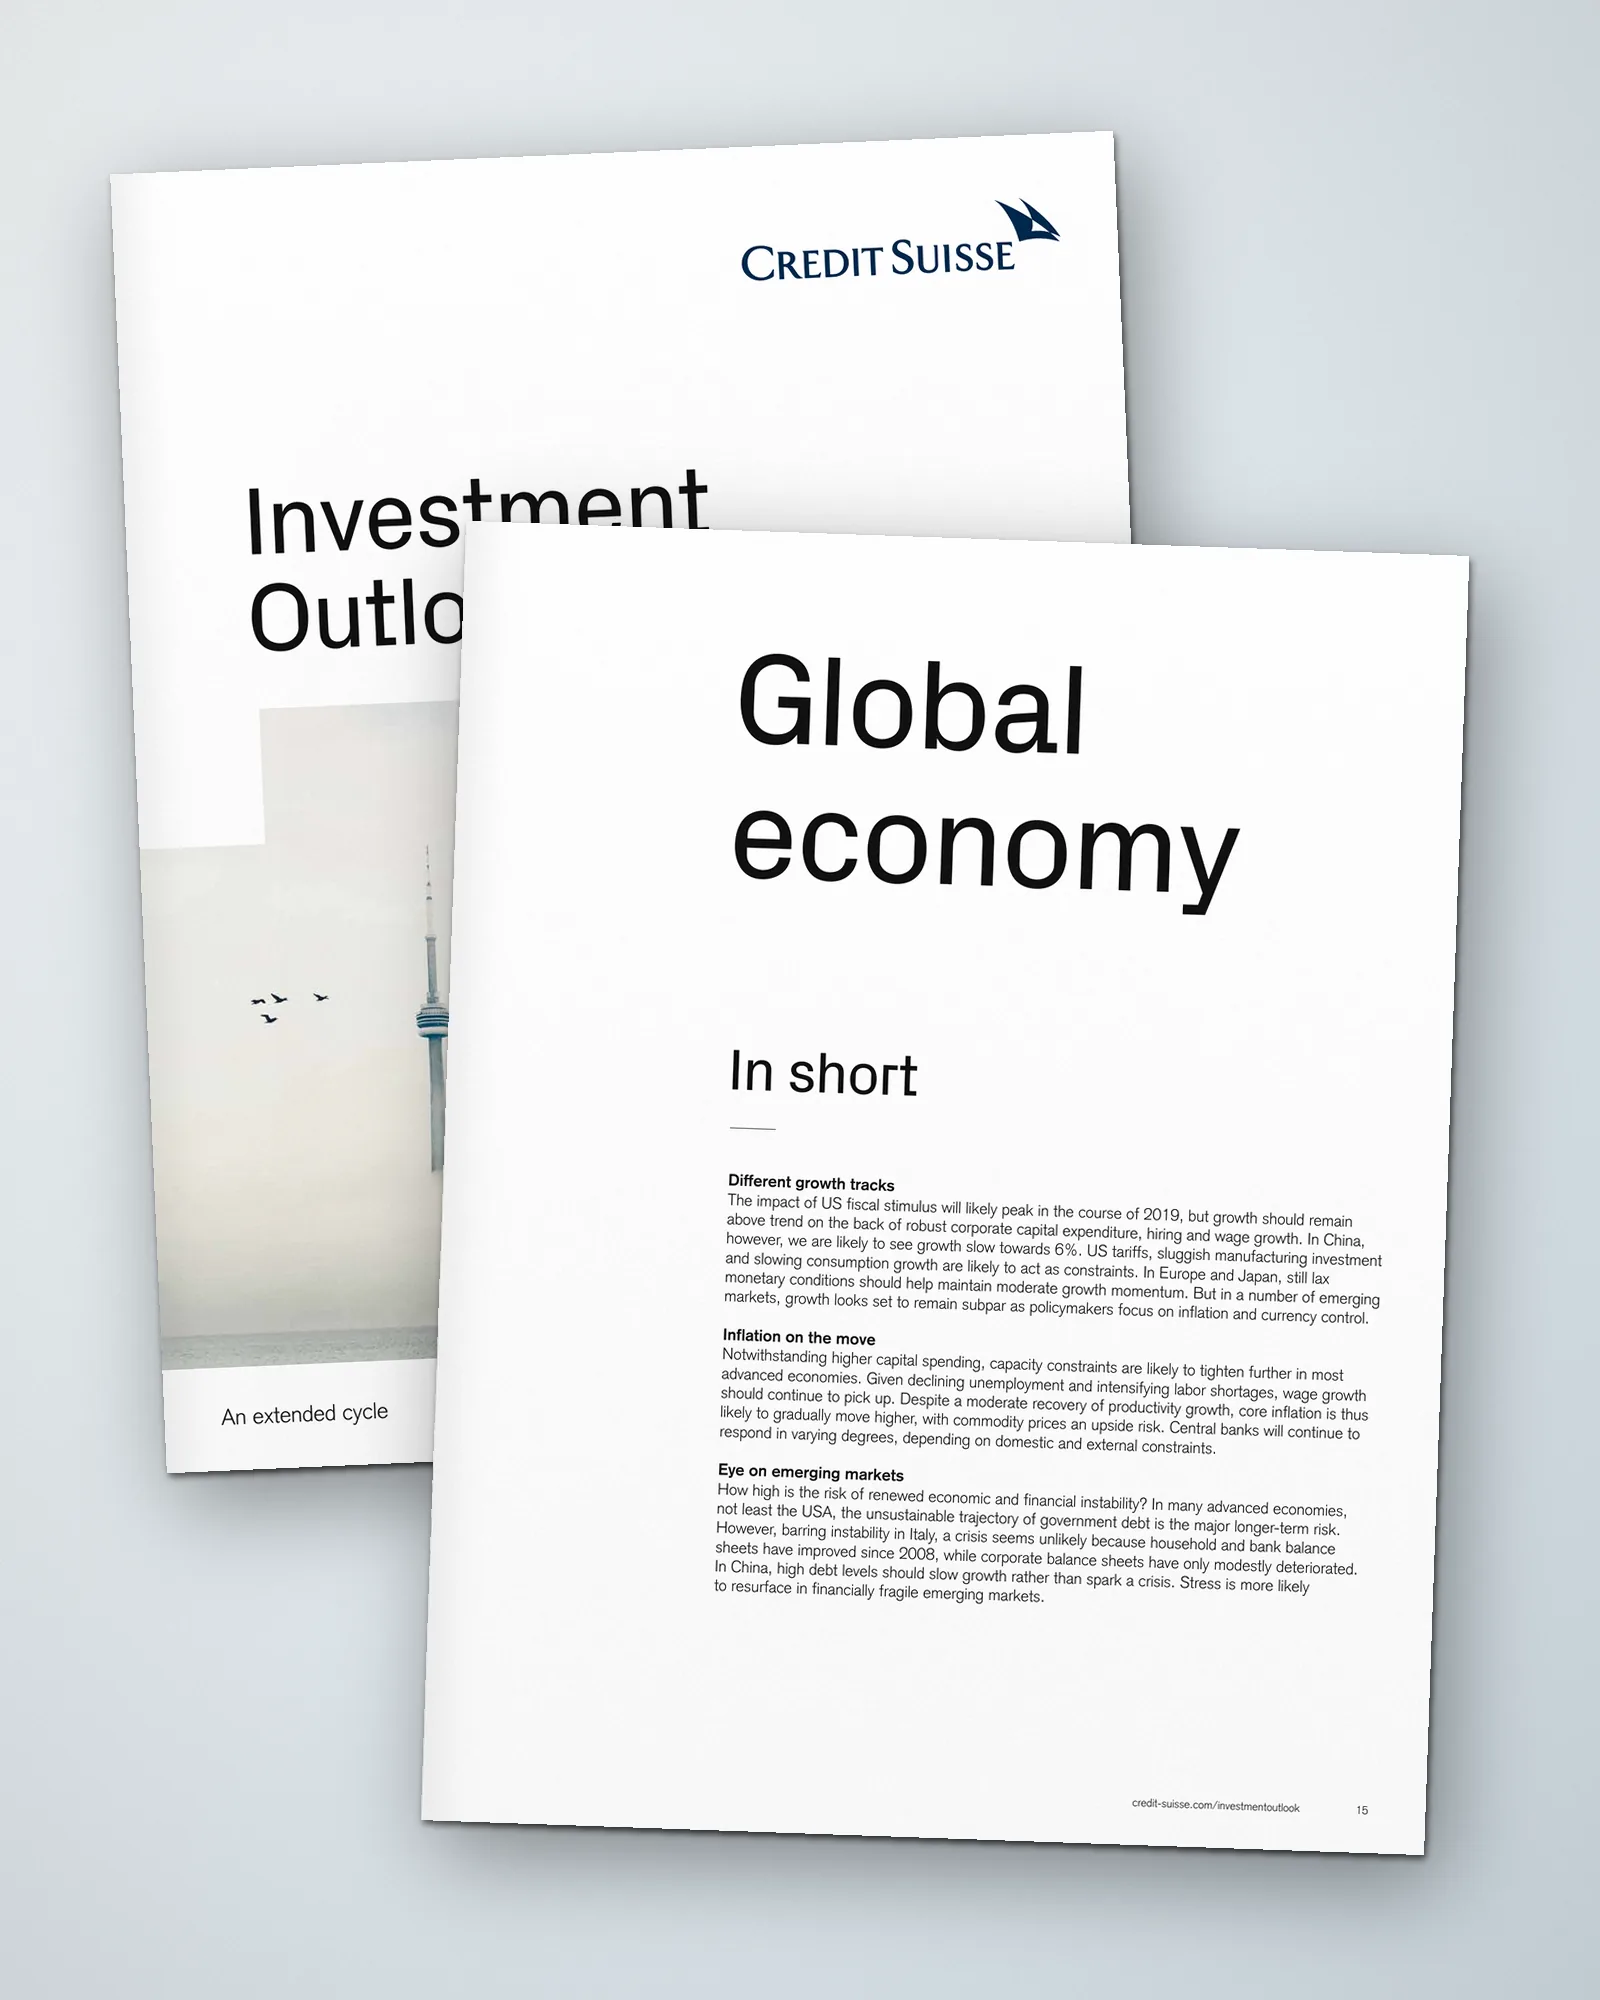
Editorial rhythm
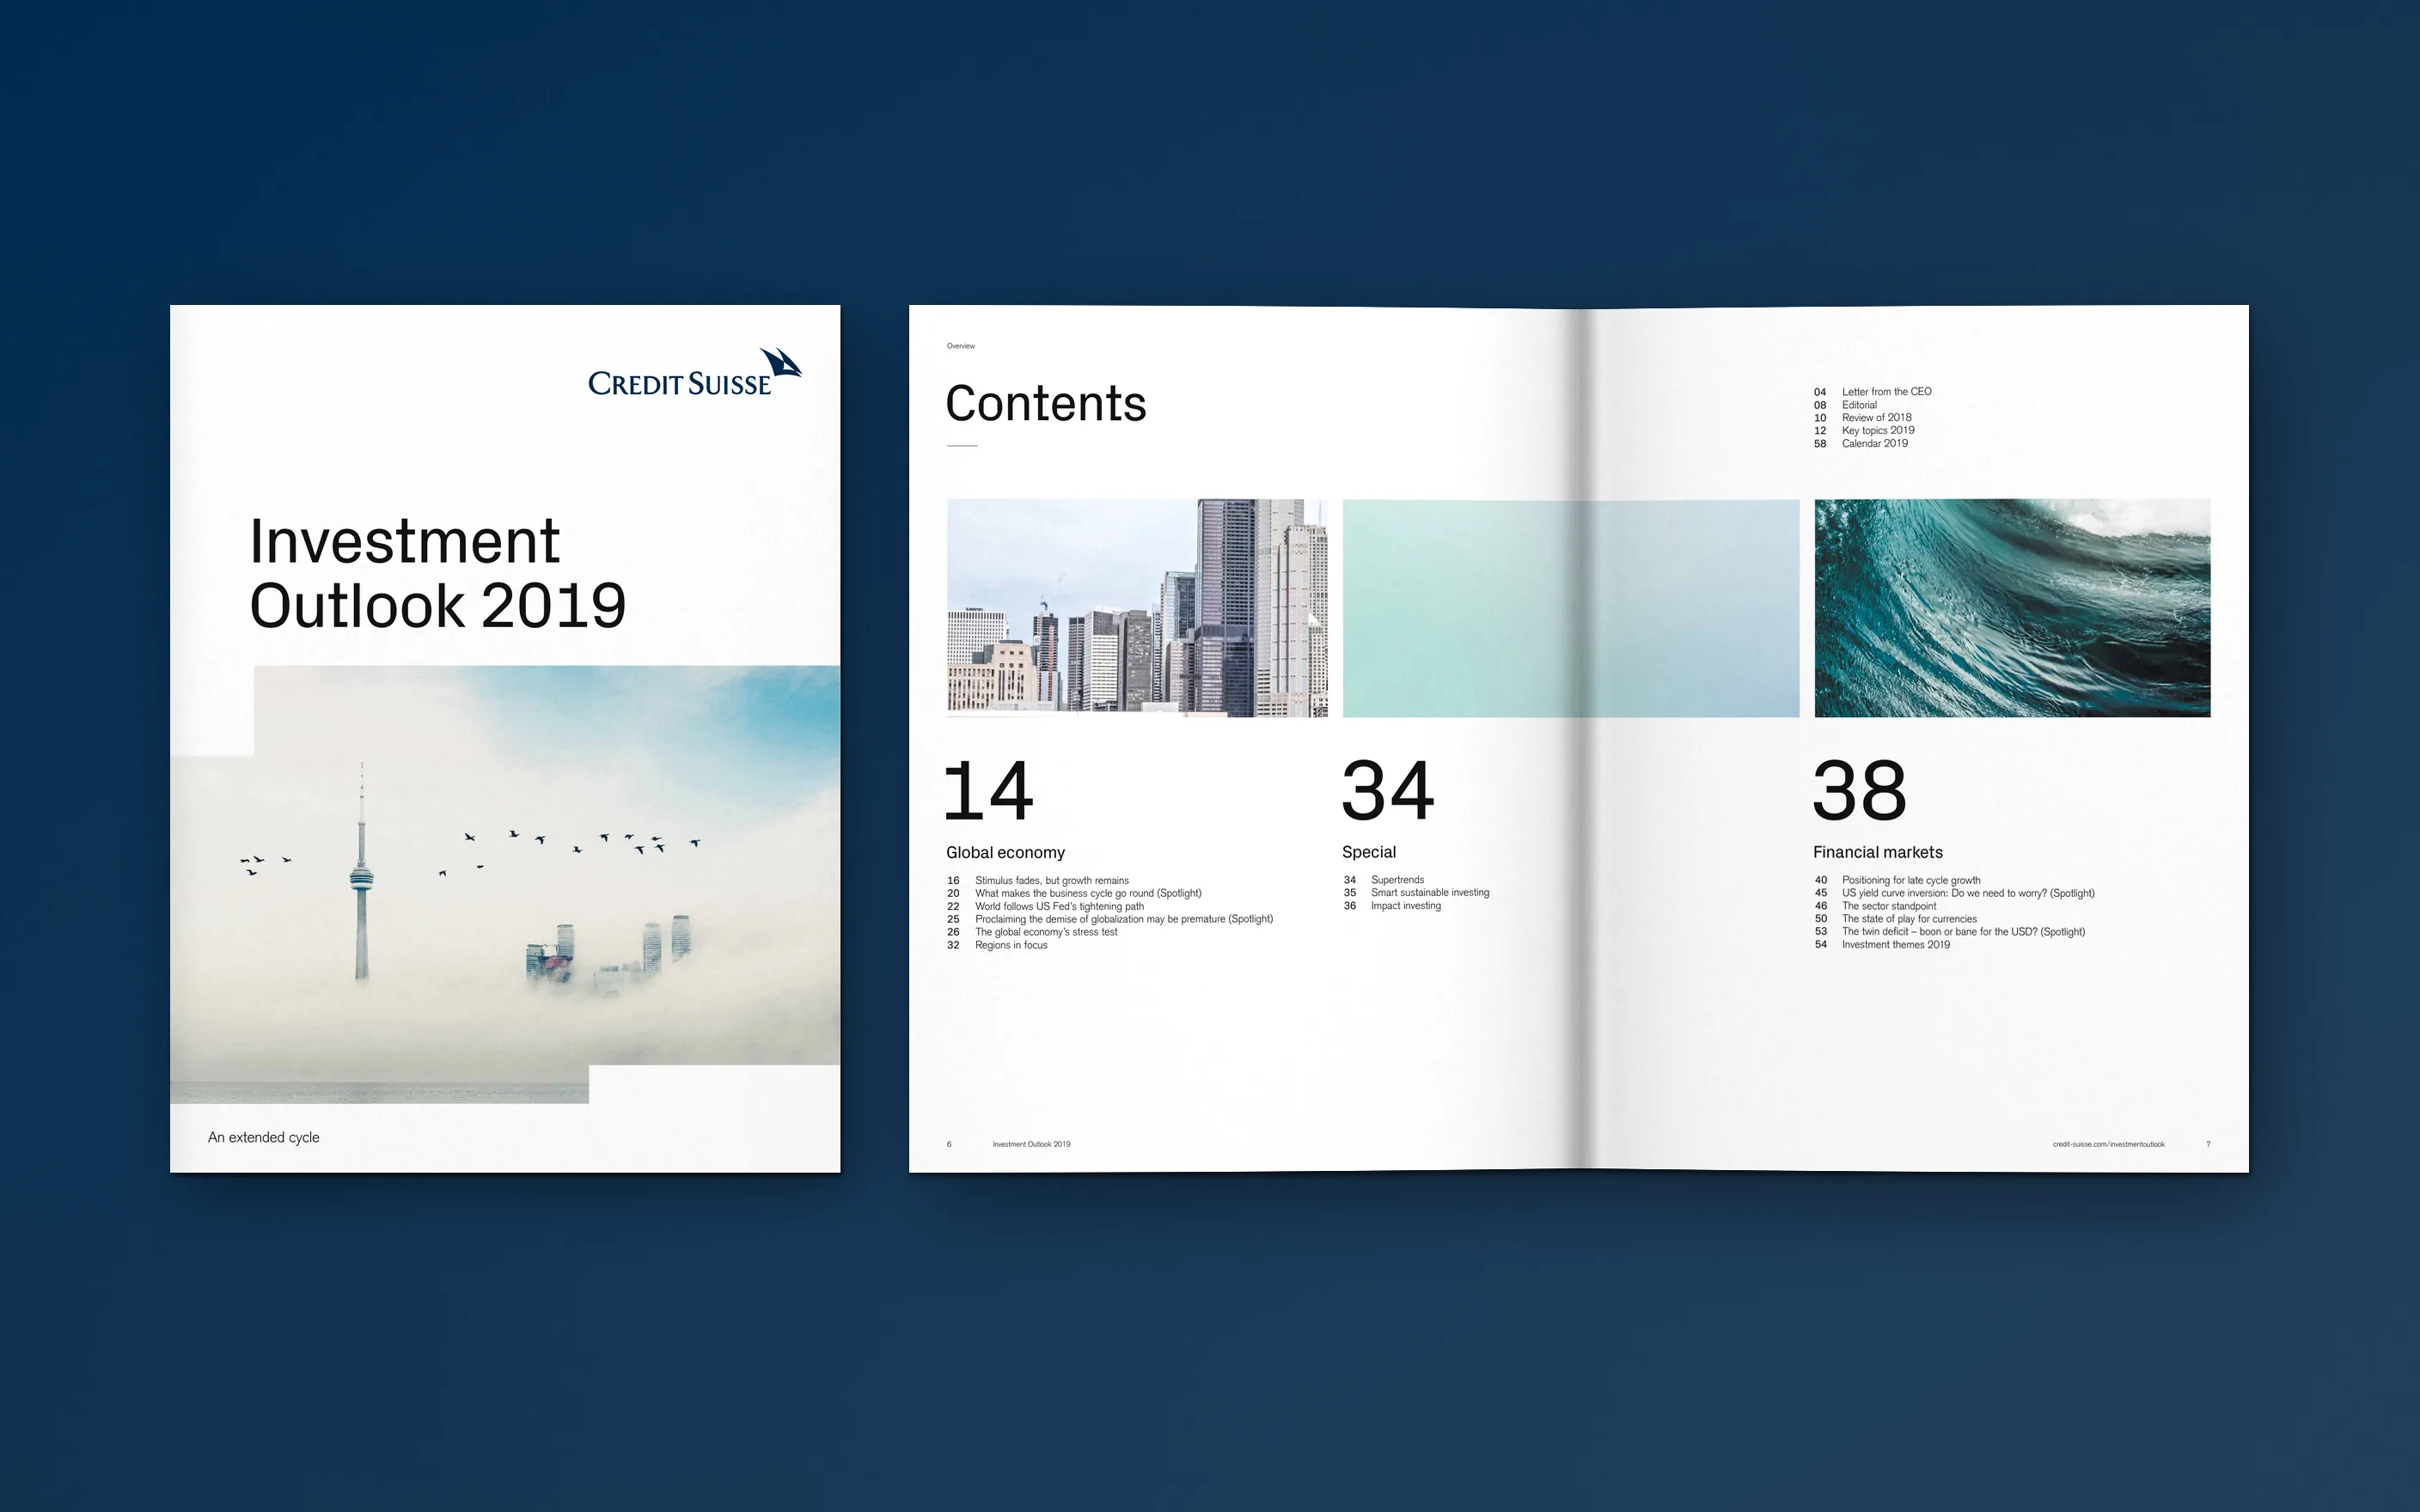
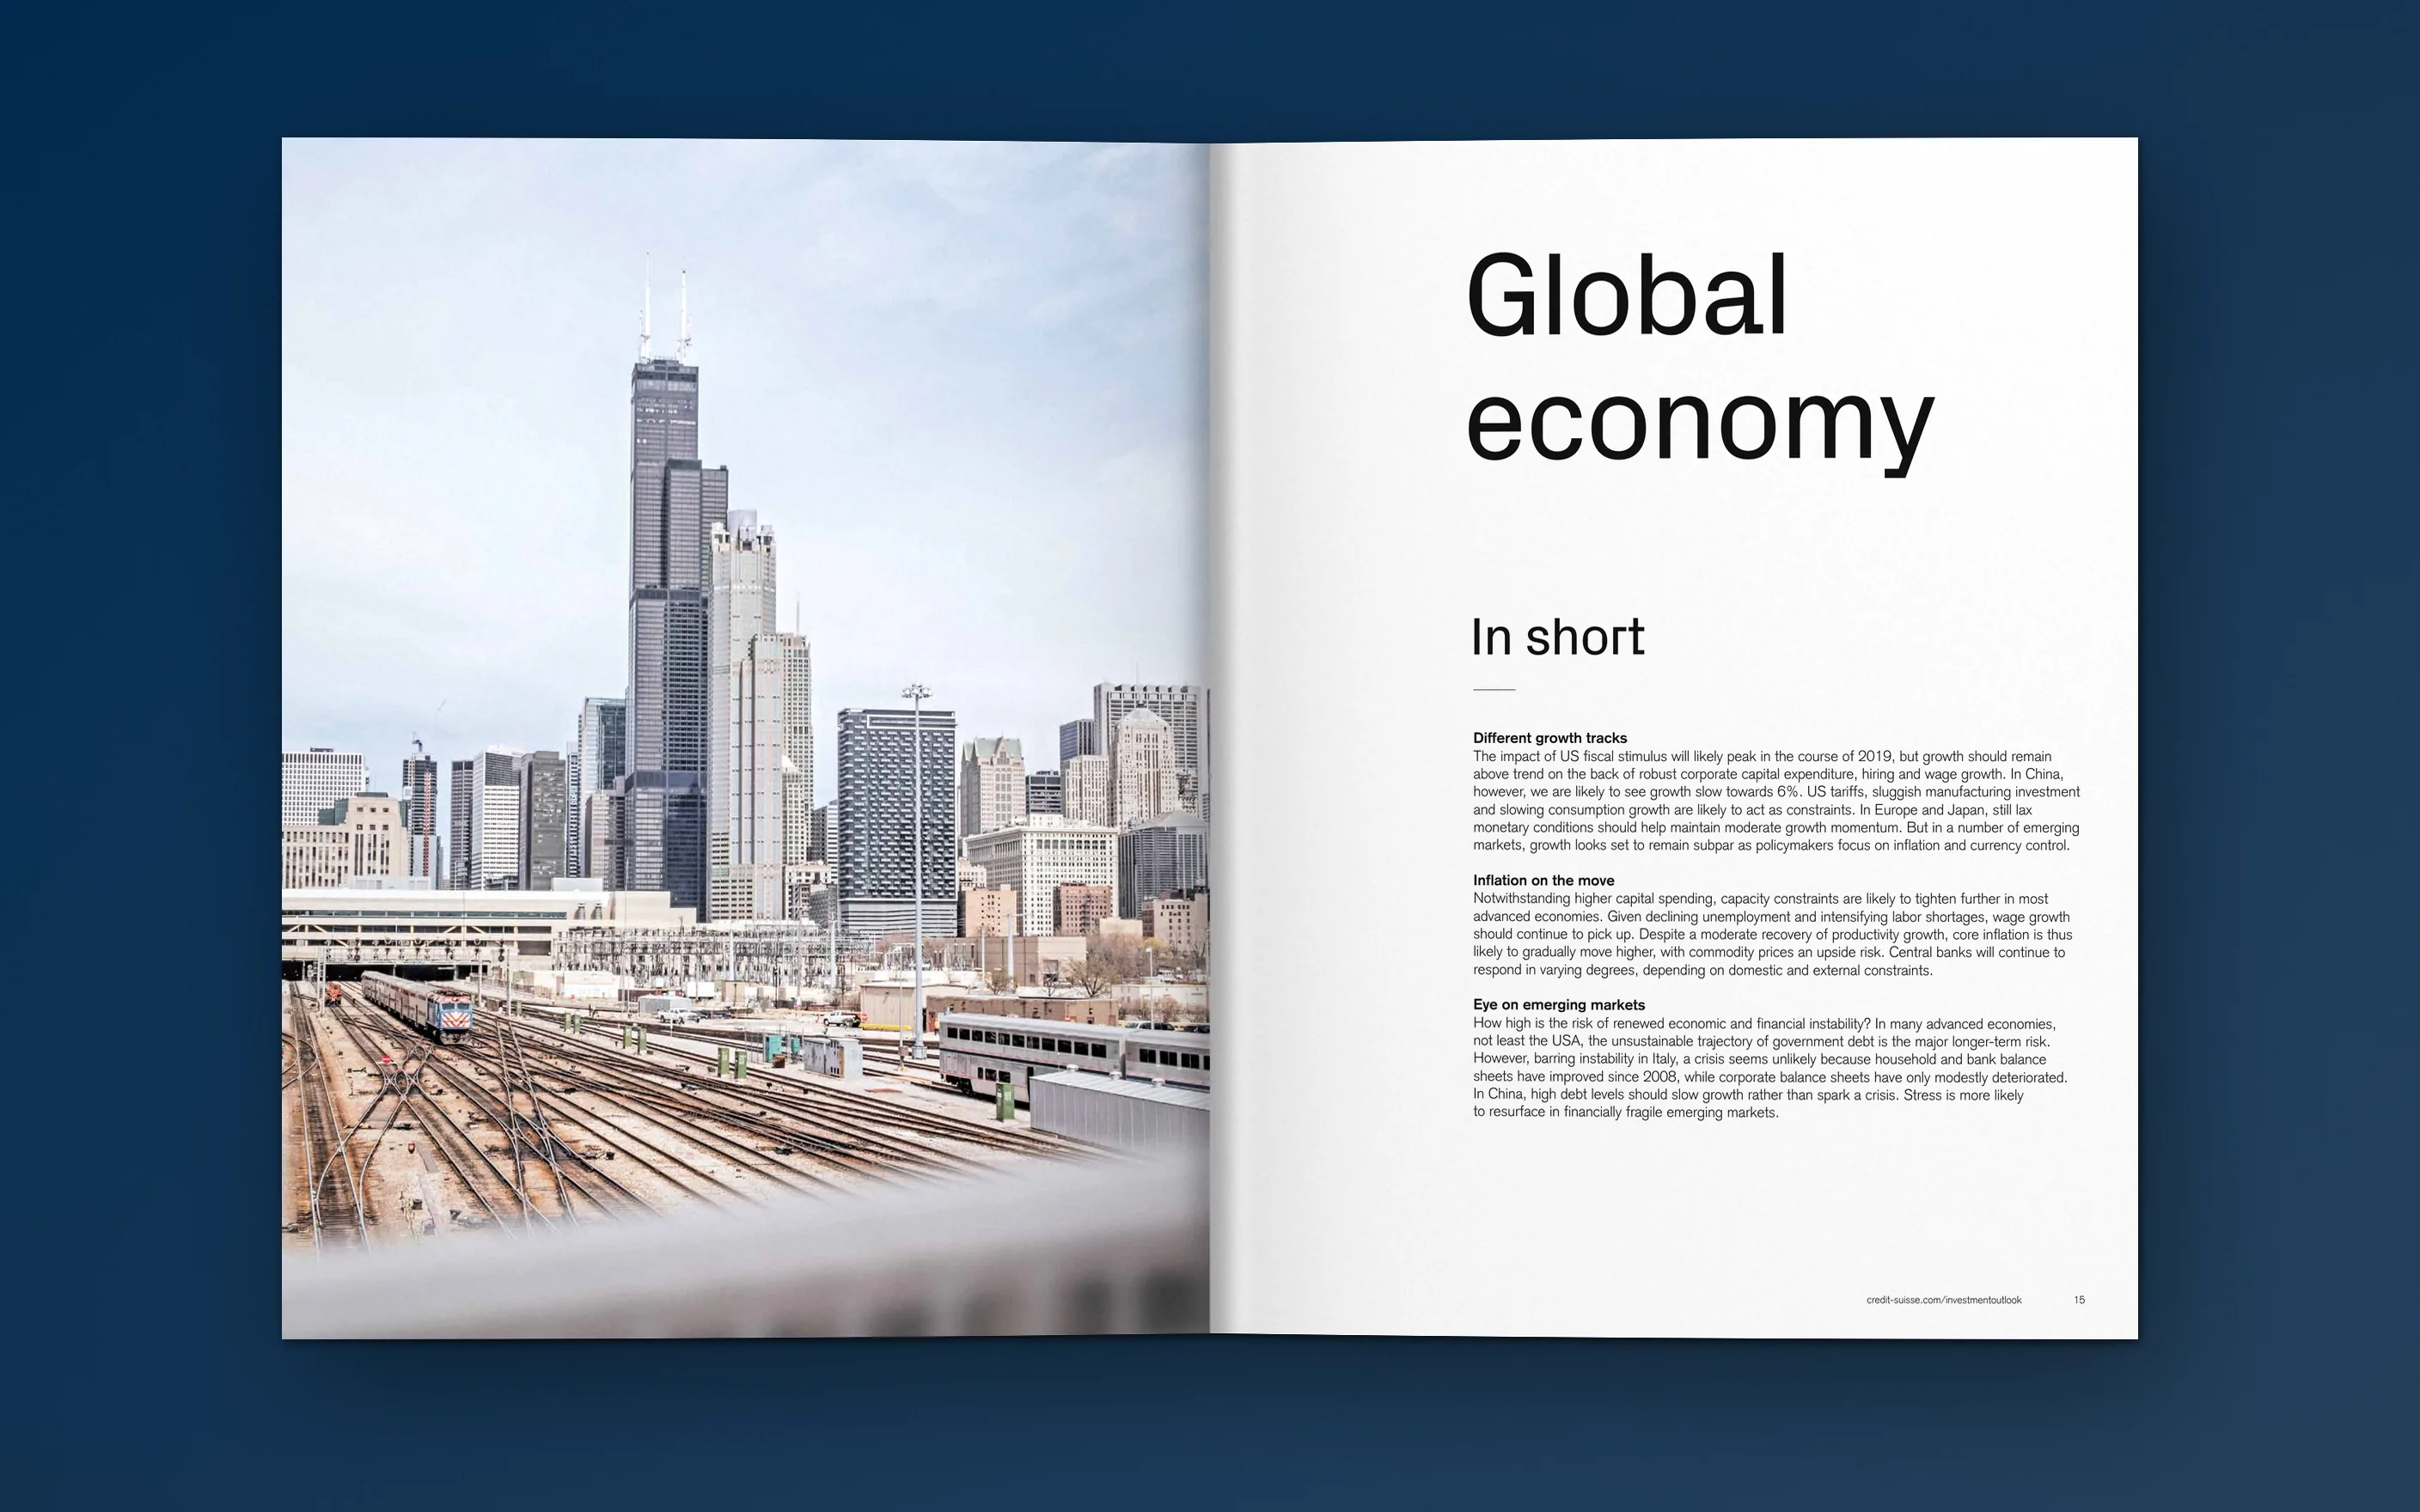
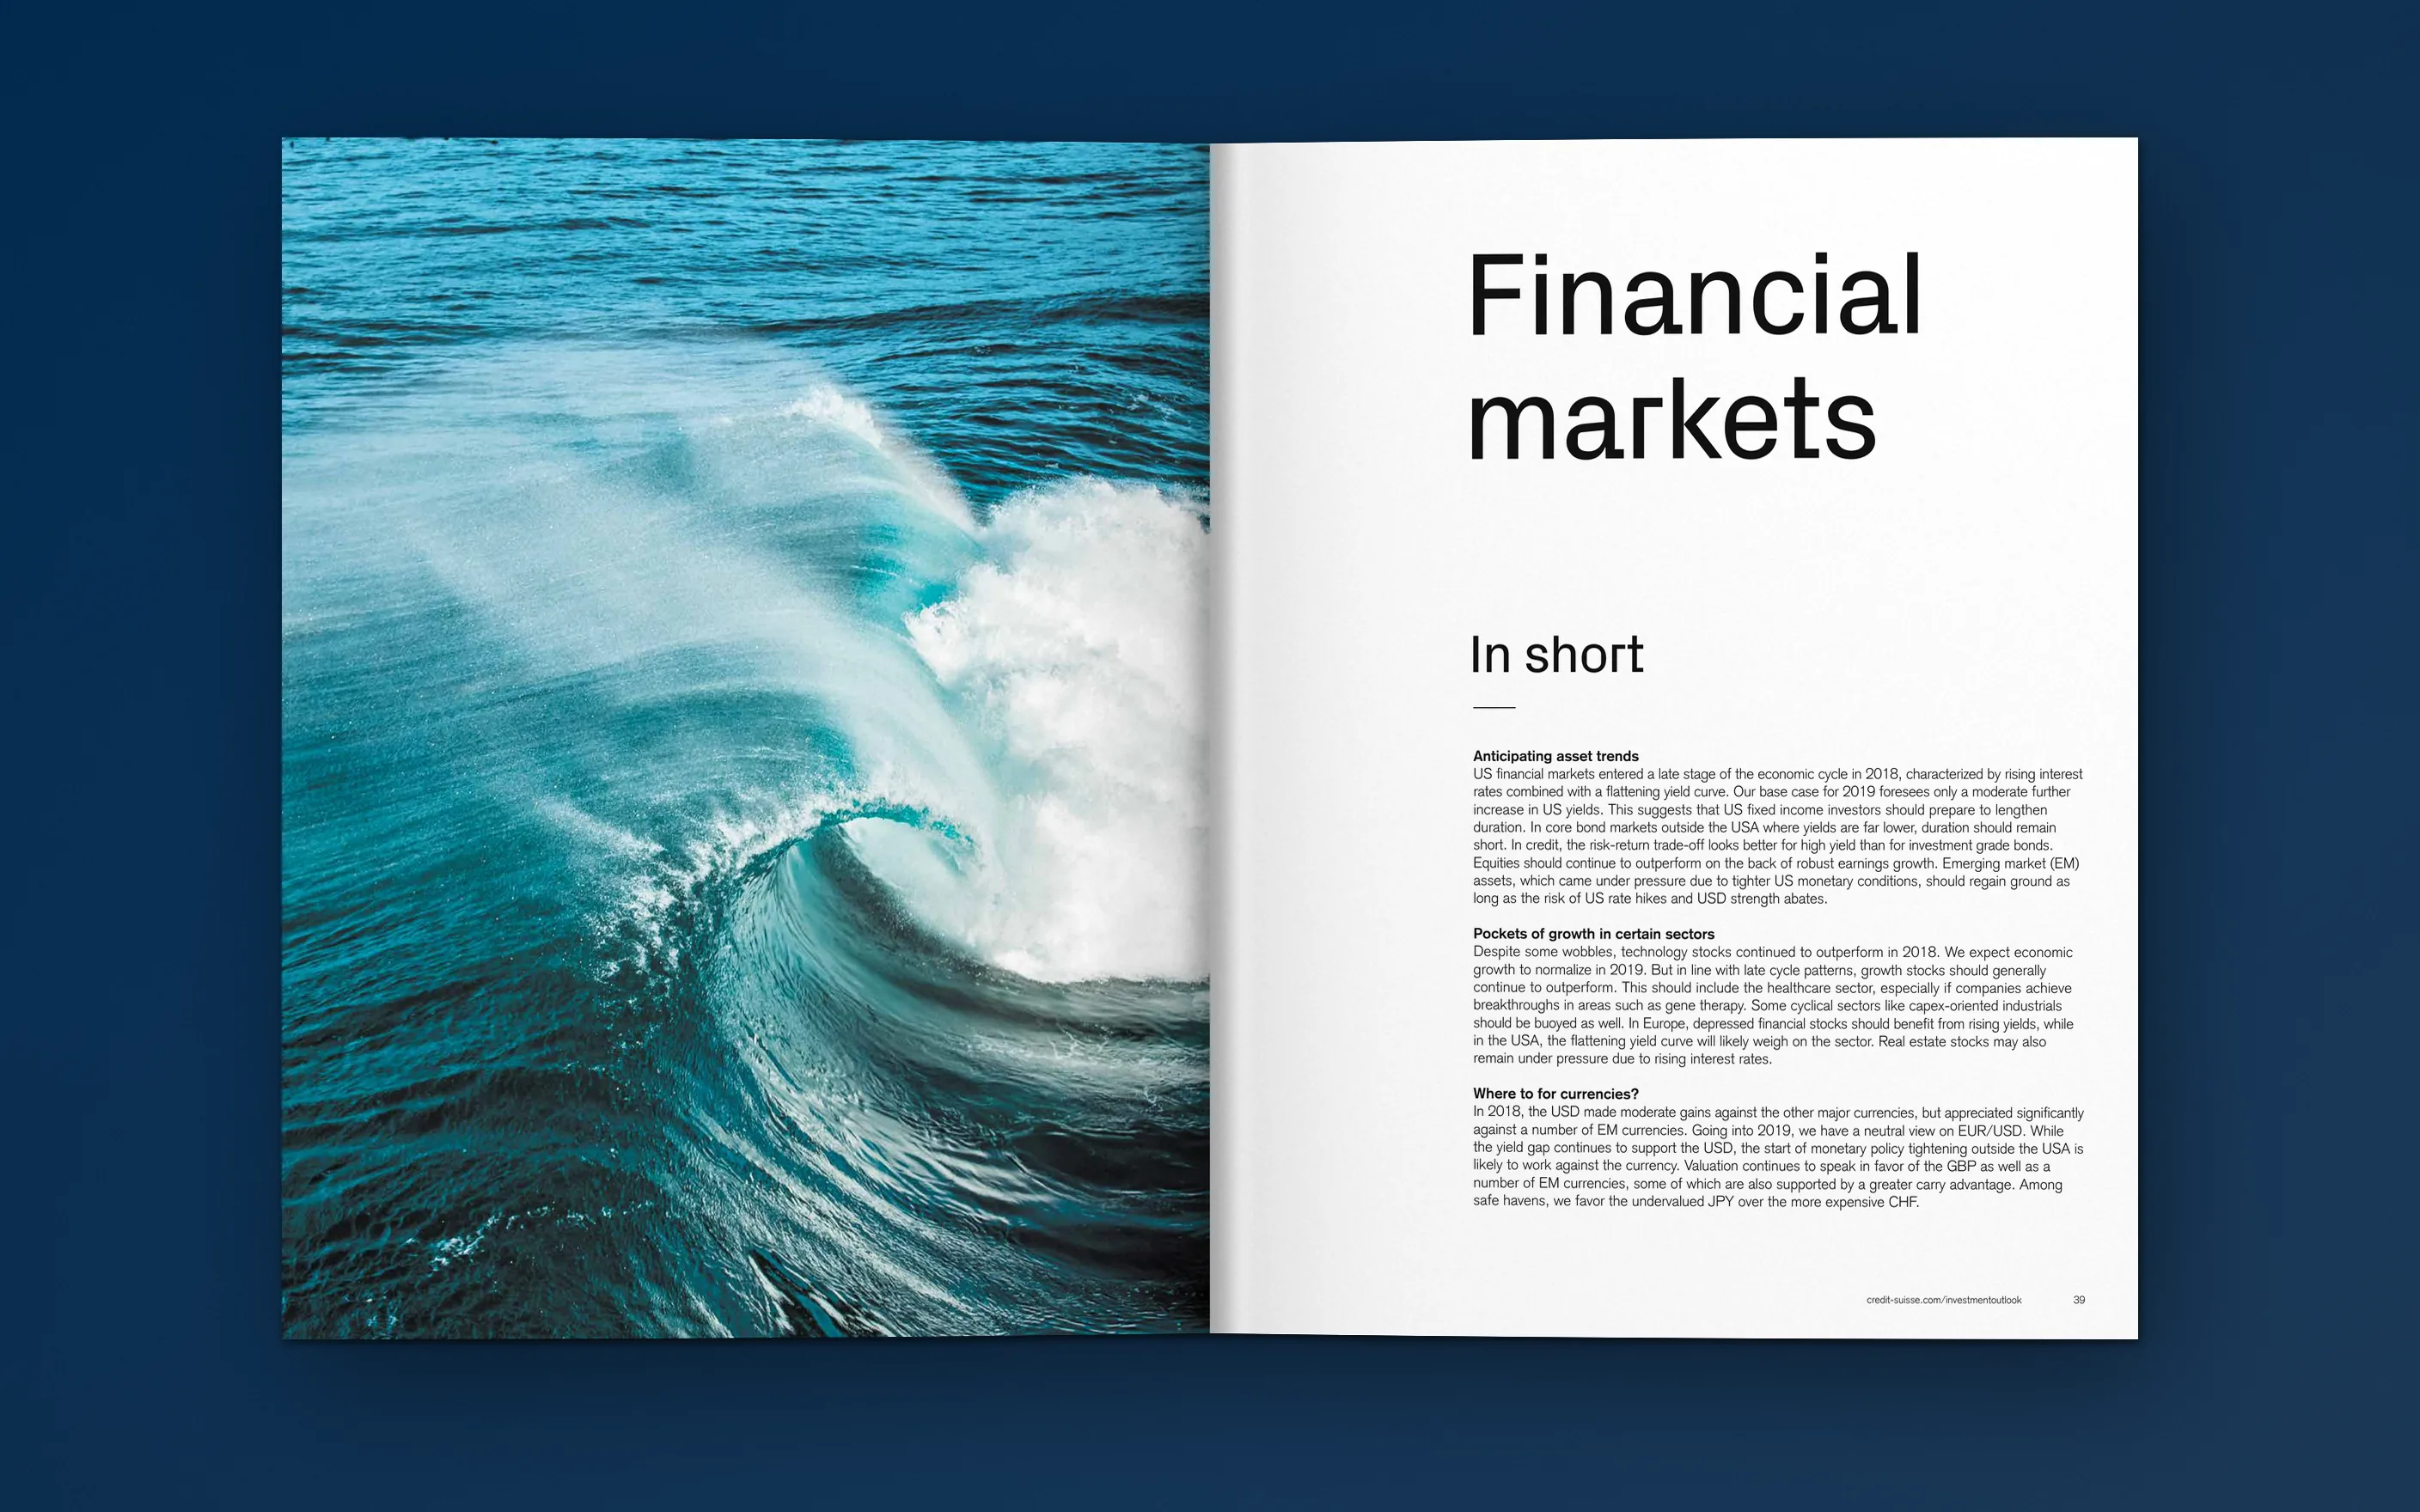
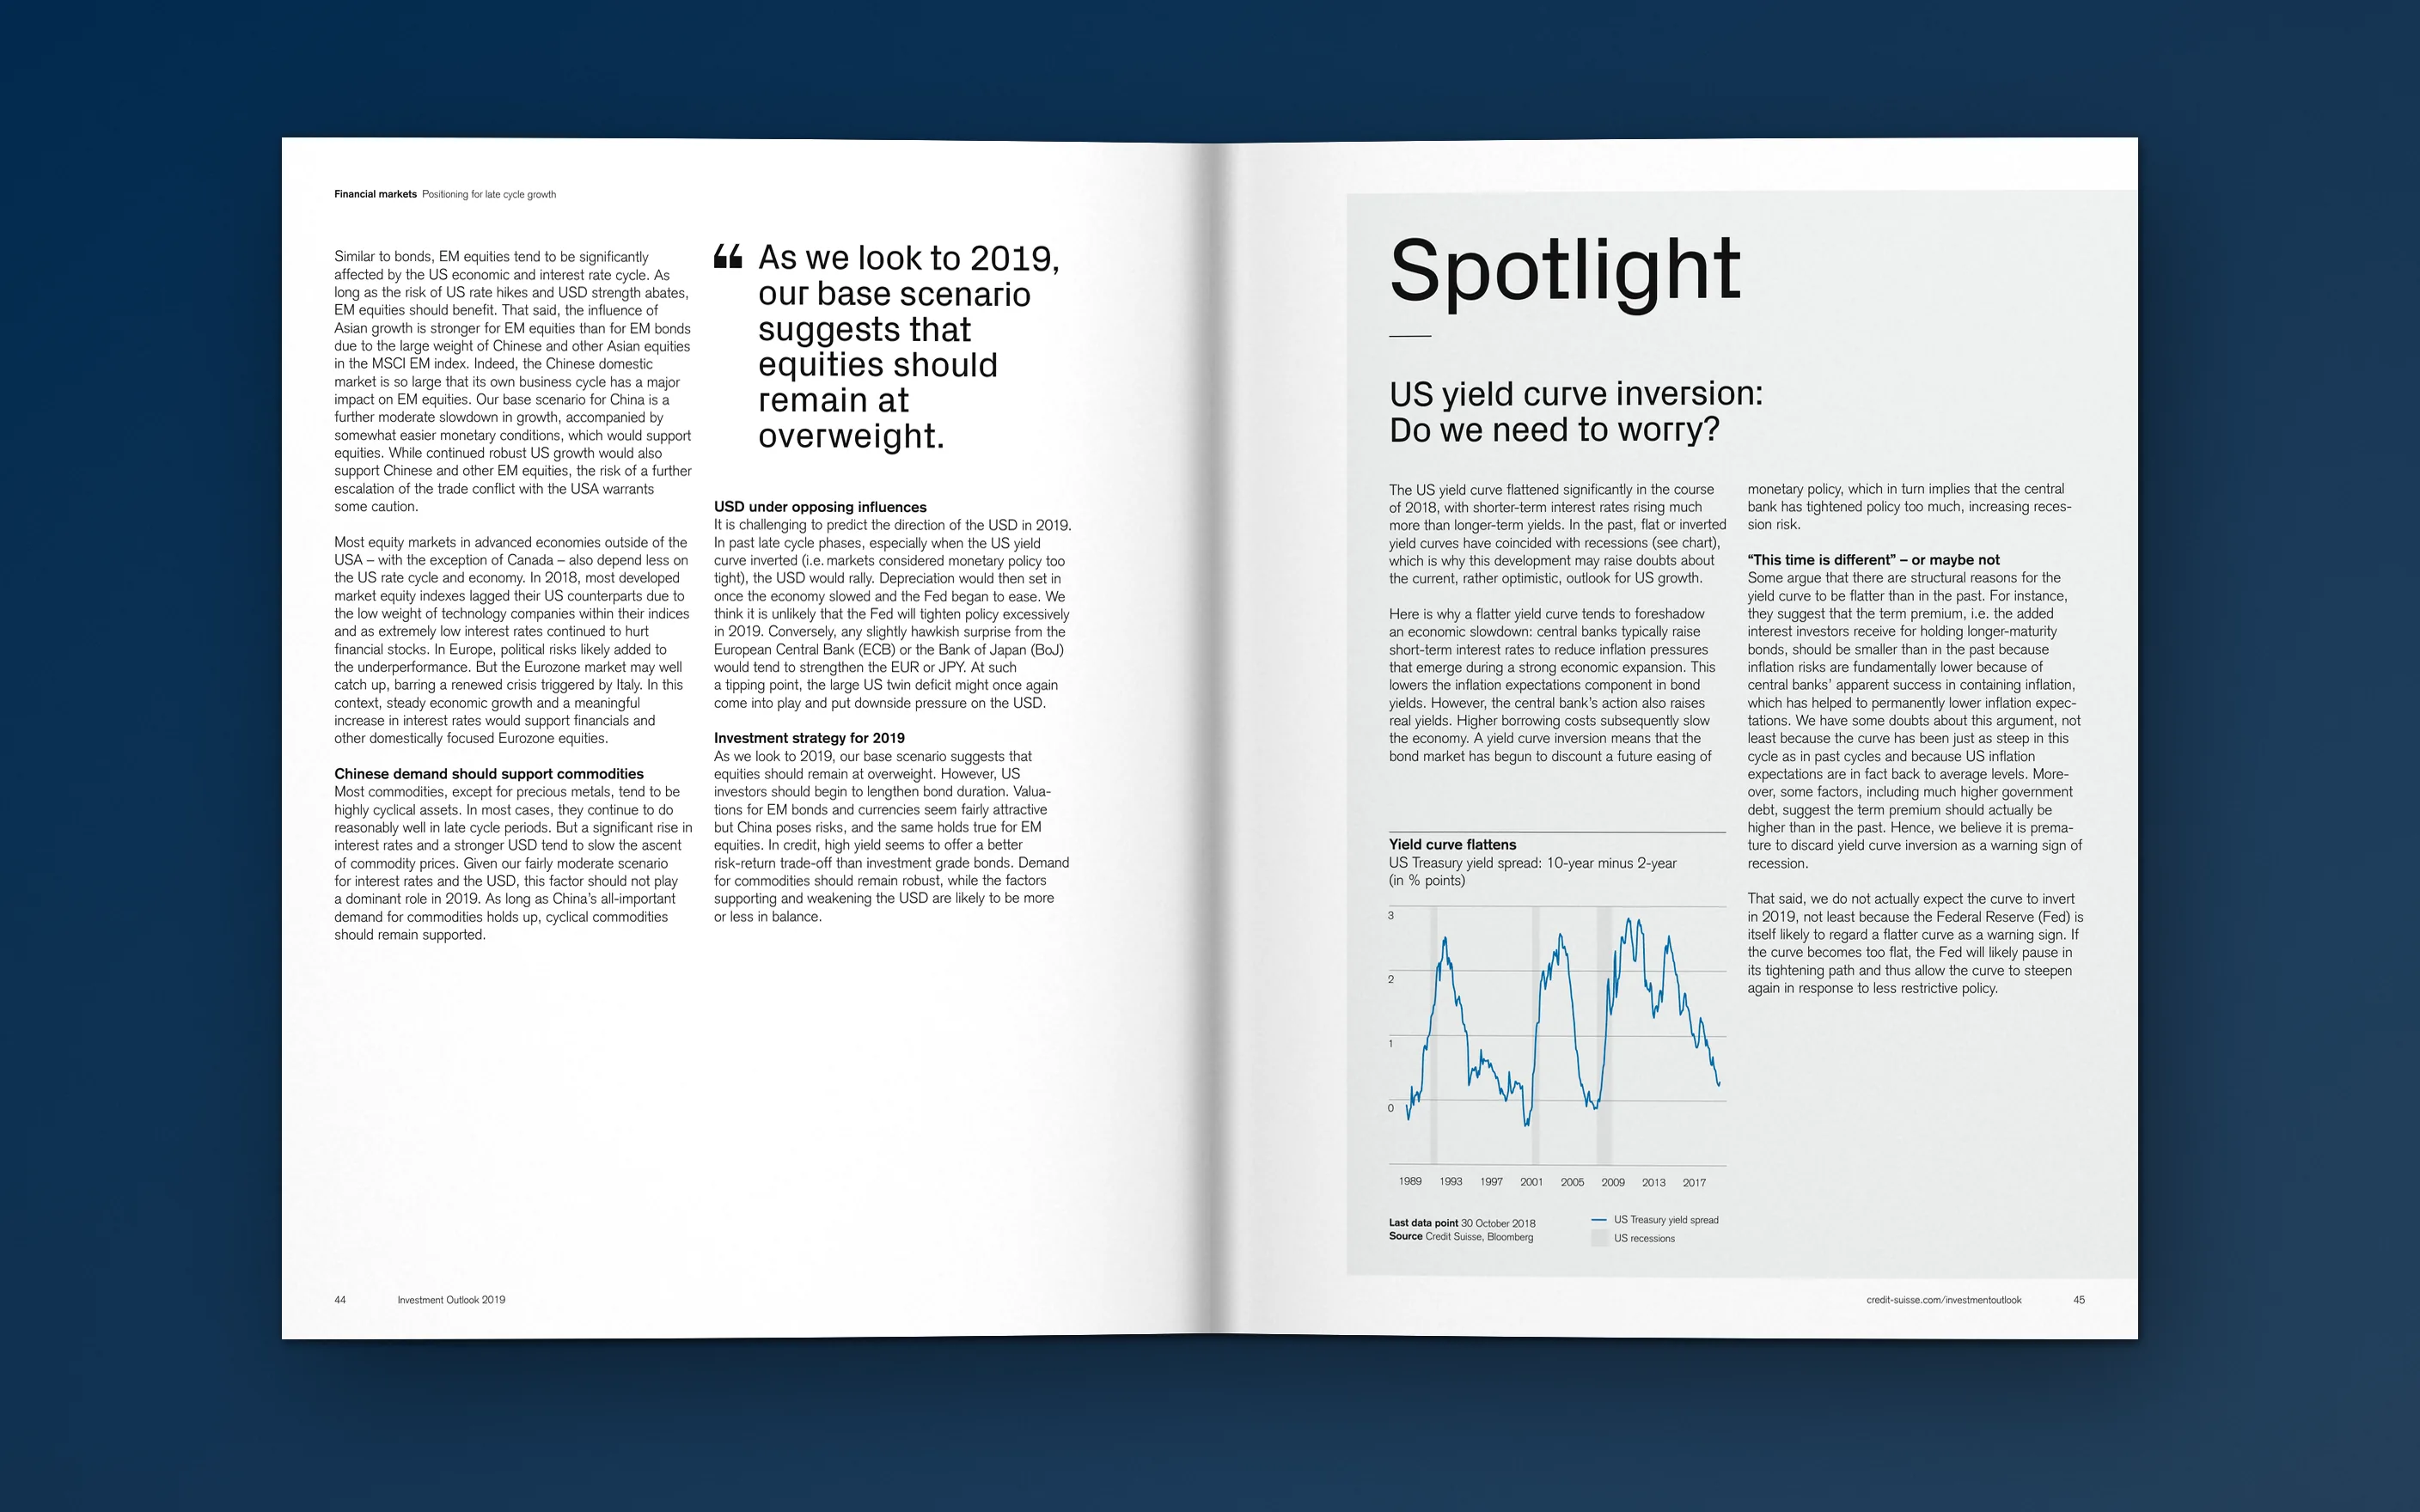
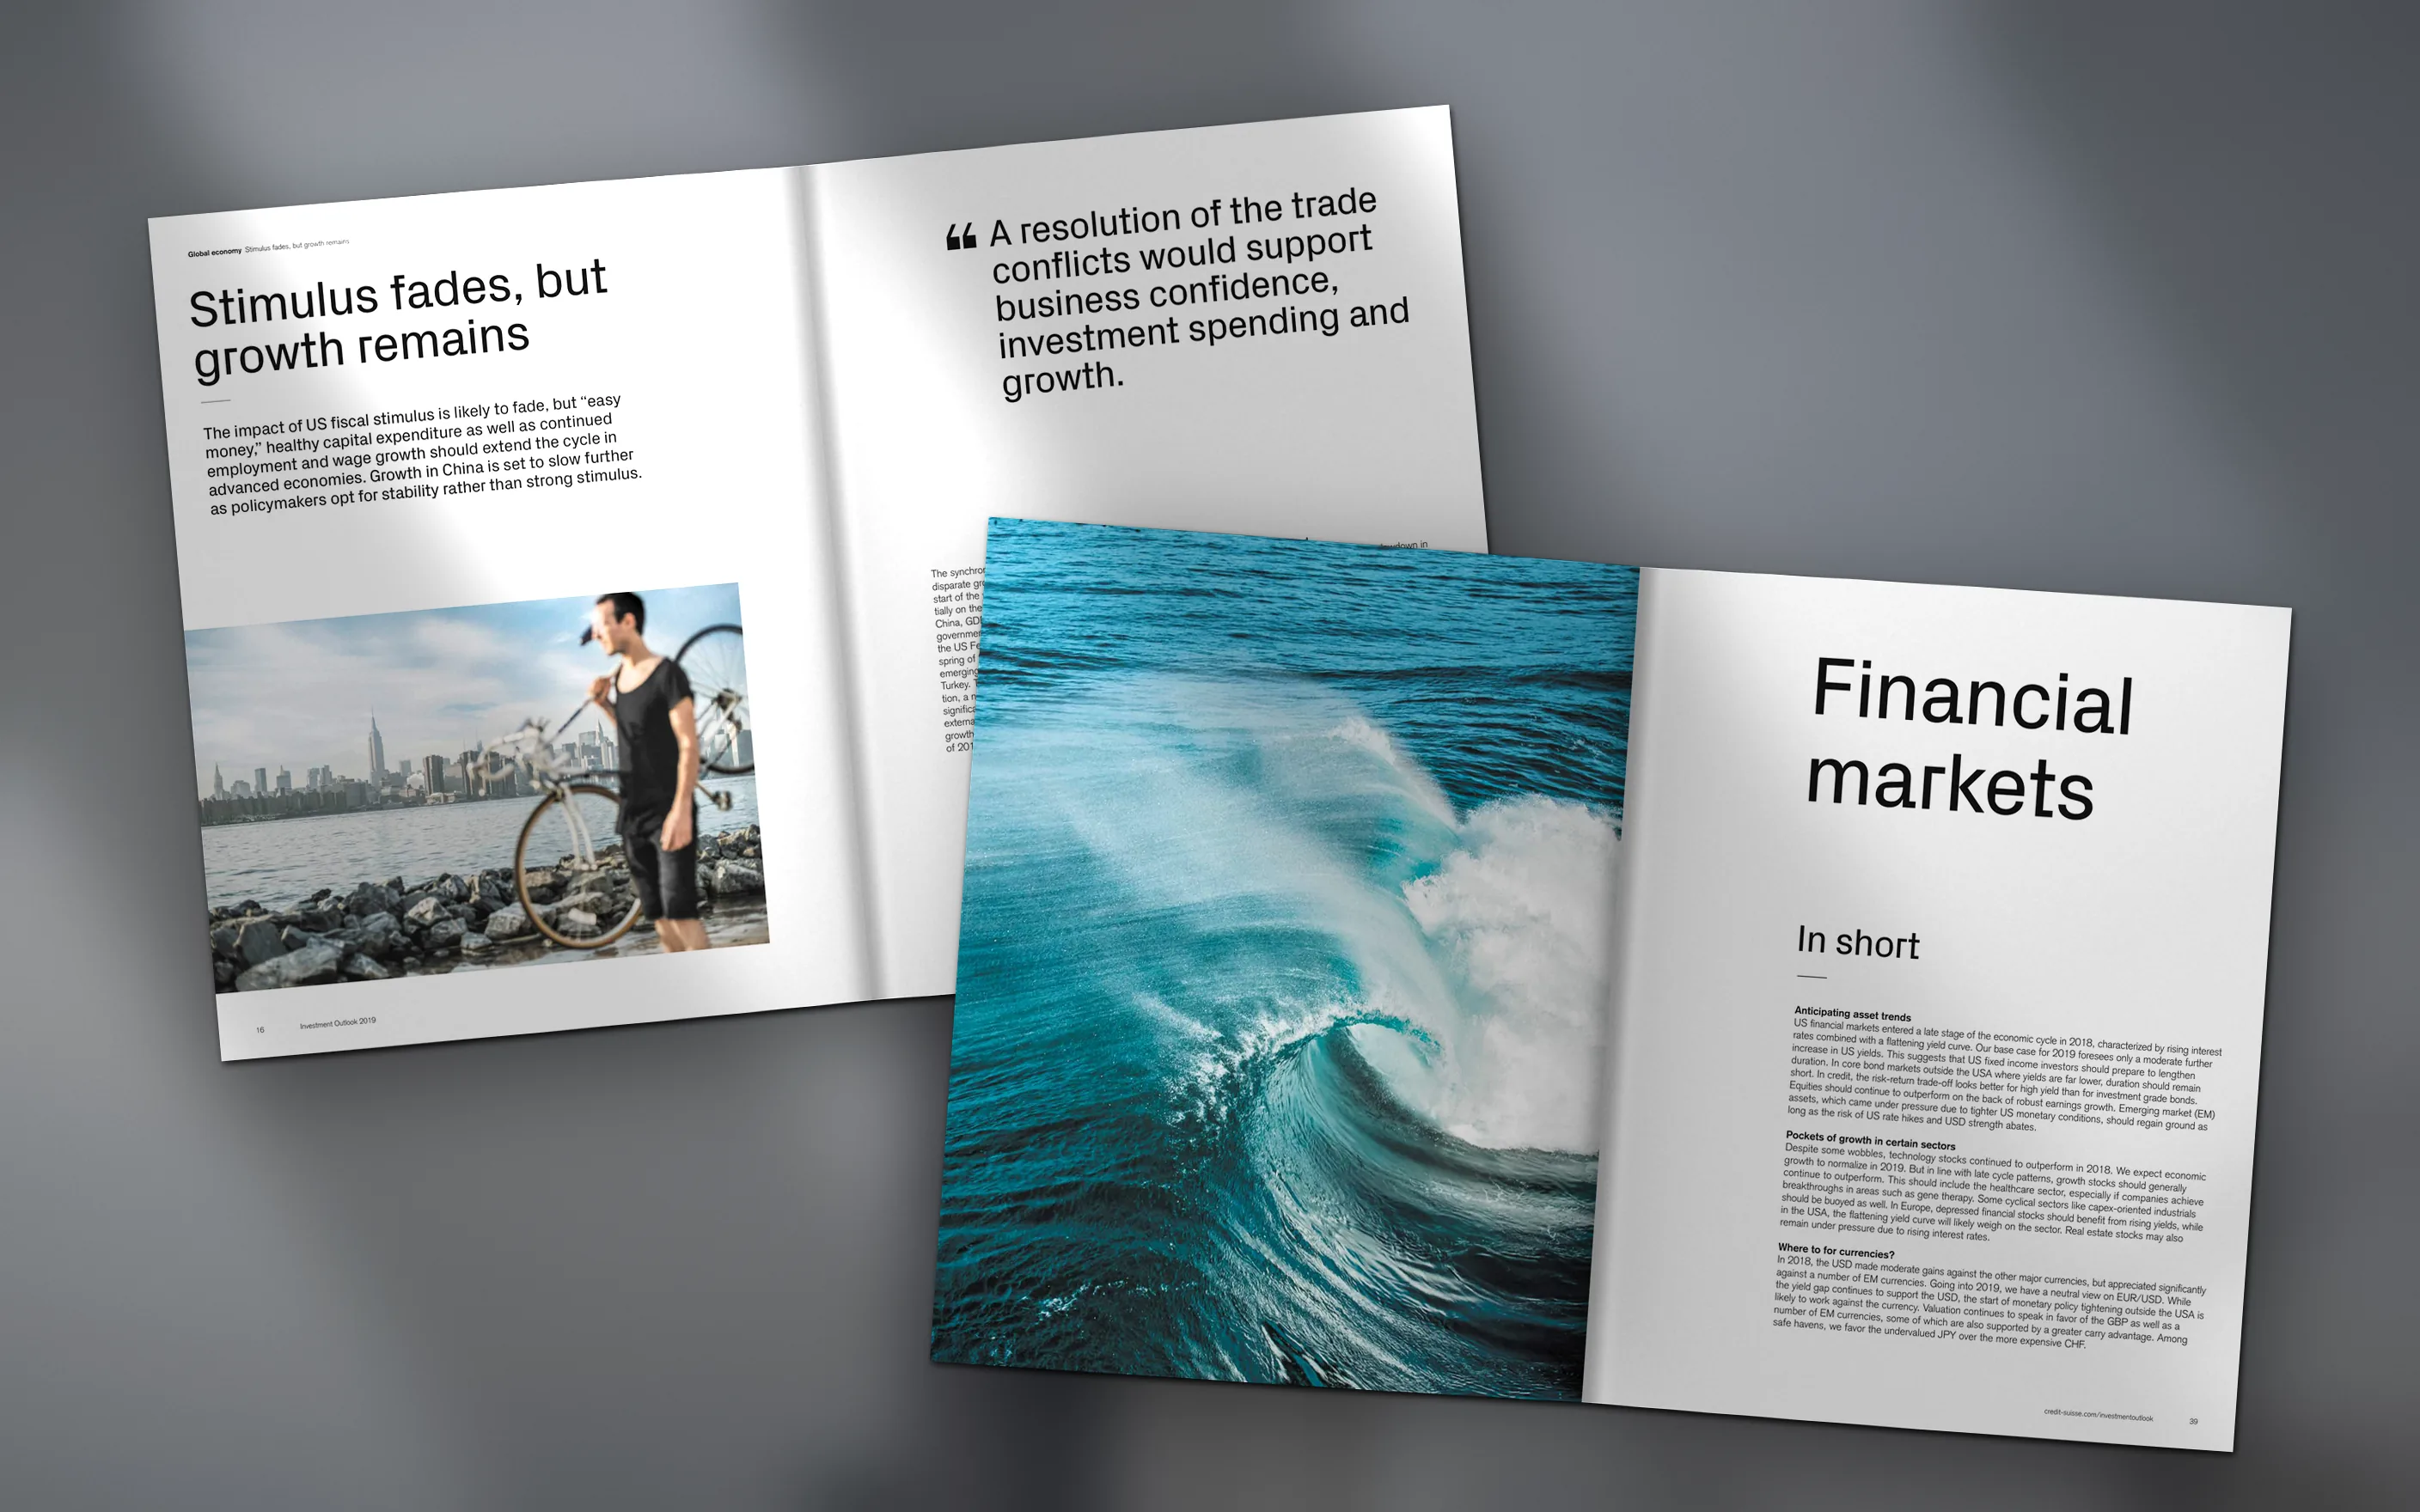
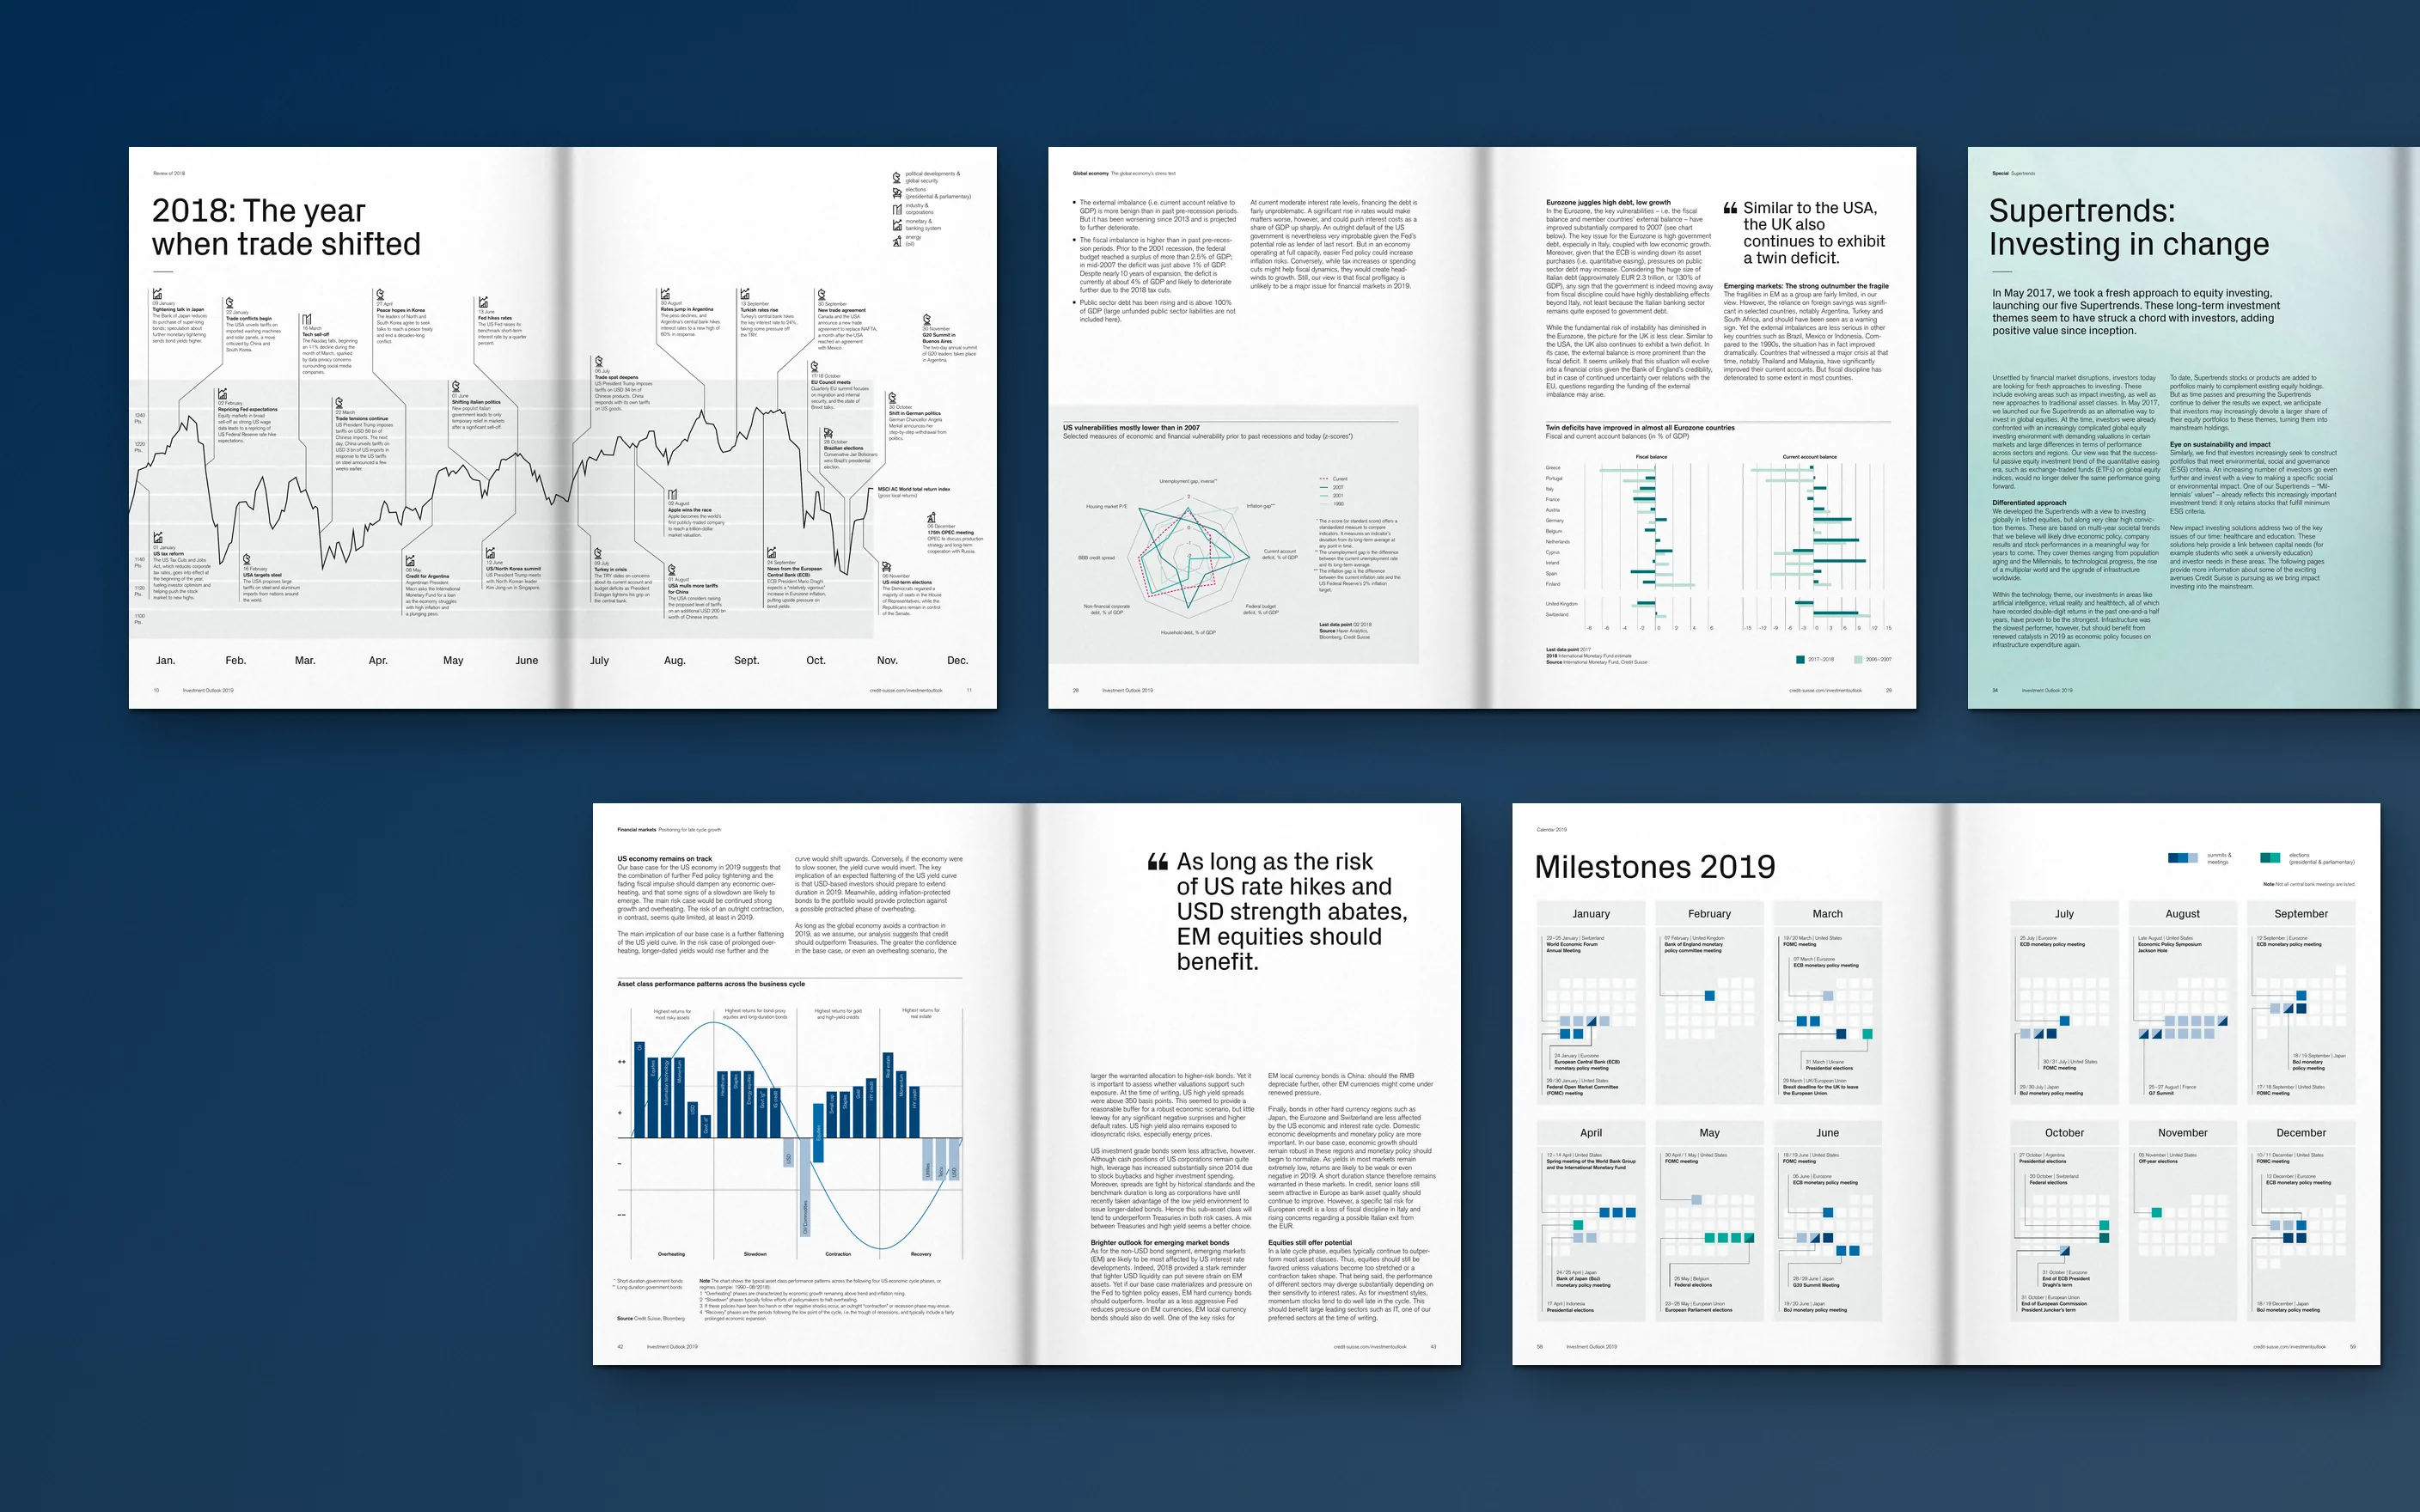
The 66 pages move through three parts: Global economy, a Special on Supertrends and impact investing, and Financial markets. The economy and markets parts open with a photographic spread and an In short summary. Recurring Spotlight pages, pull quotes and a strict grid give dense economic analysis a calm, predictable rhythm, so readers always know where they are.
One chart system
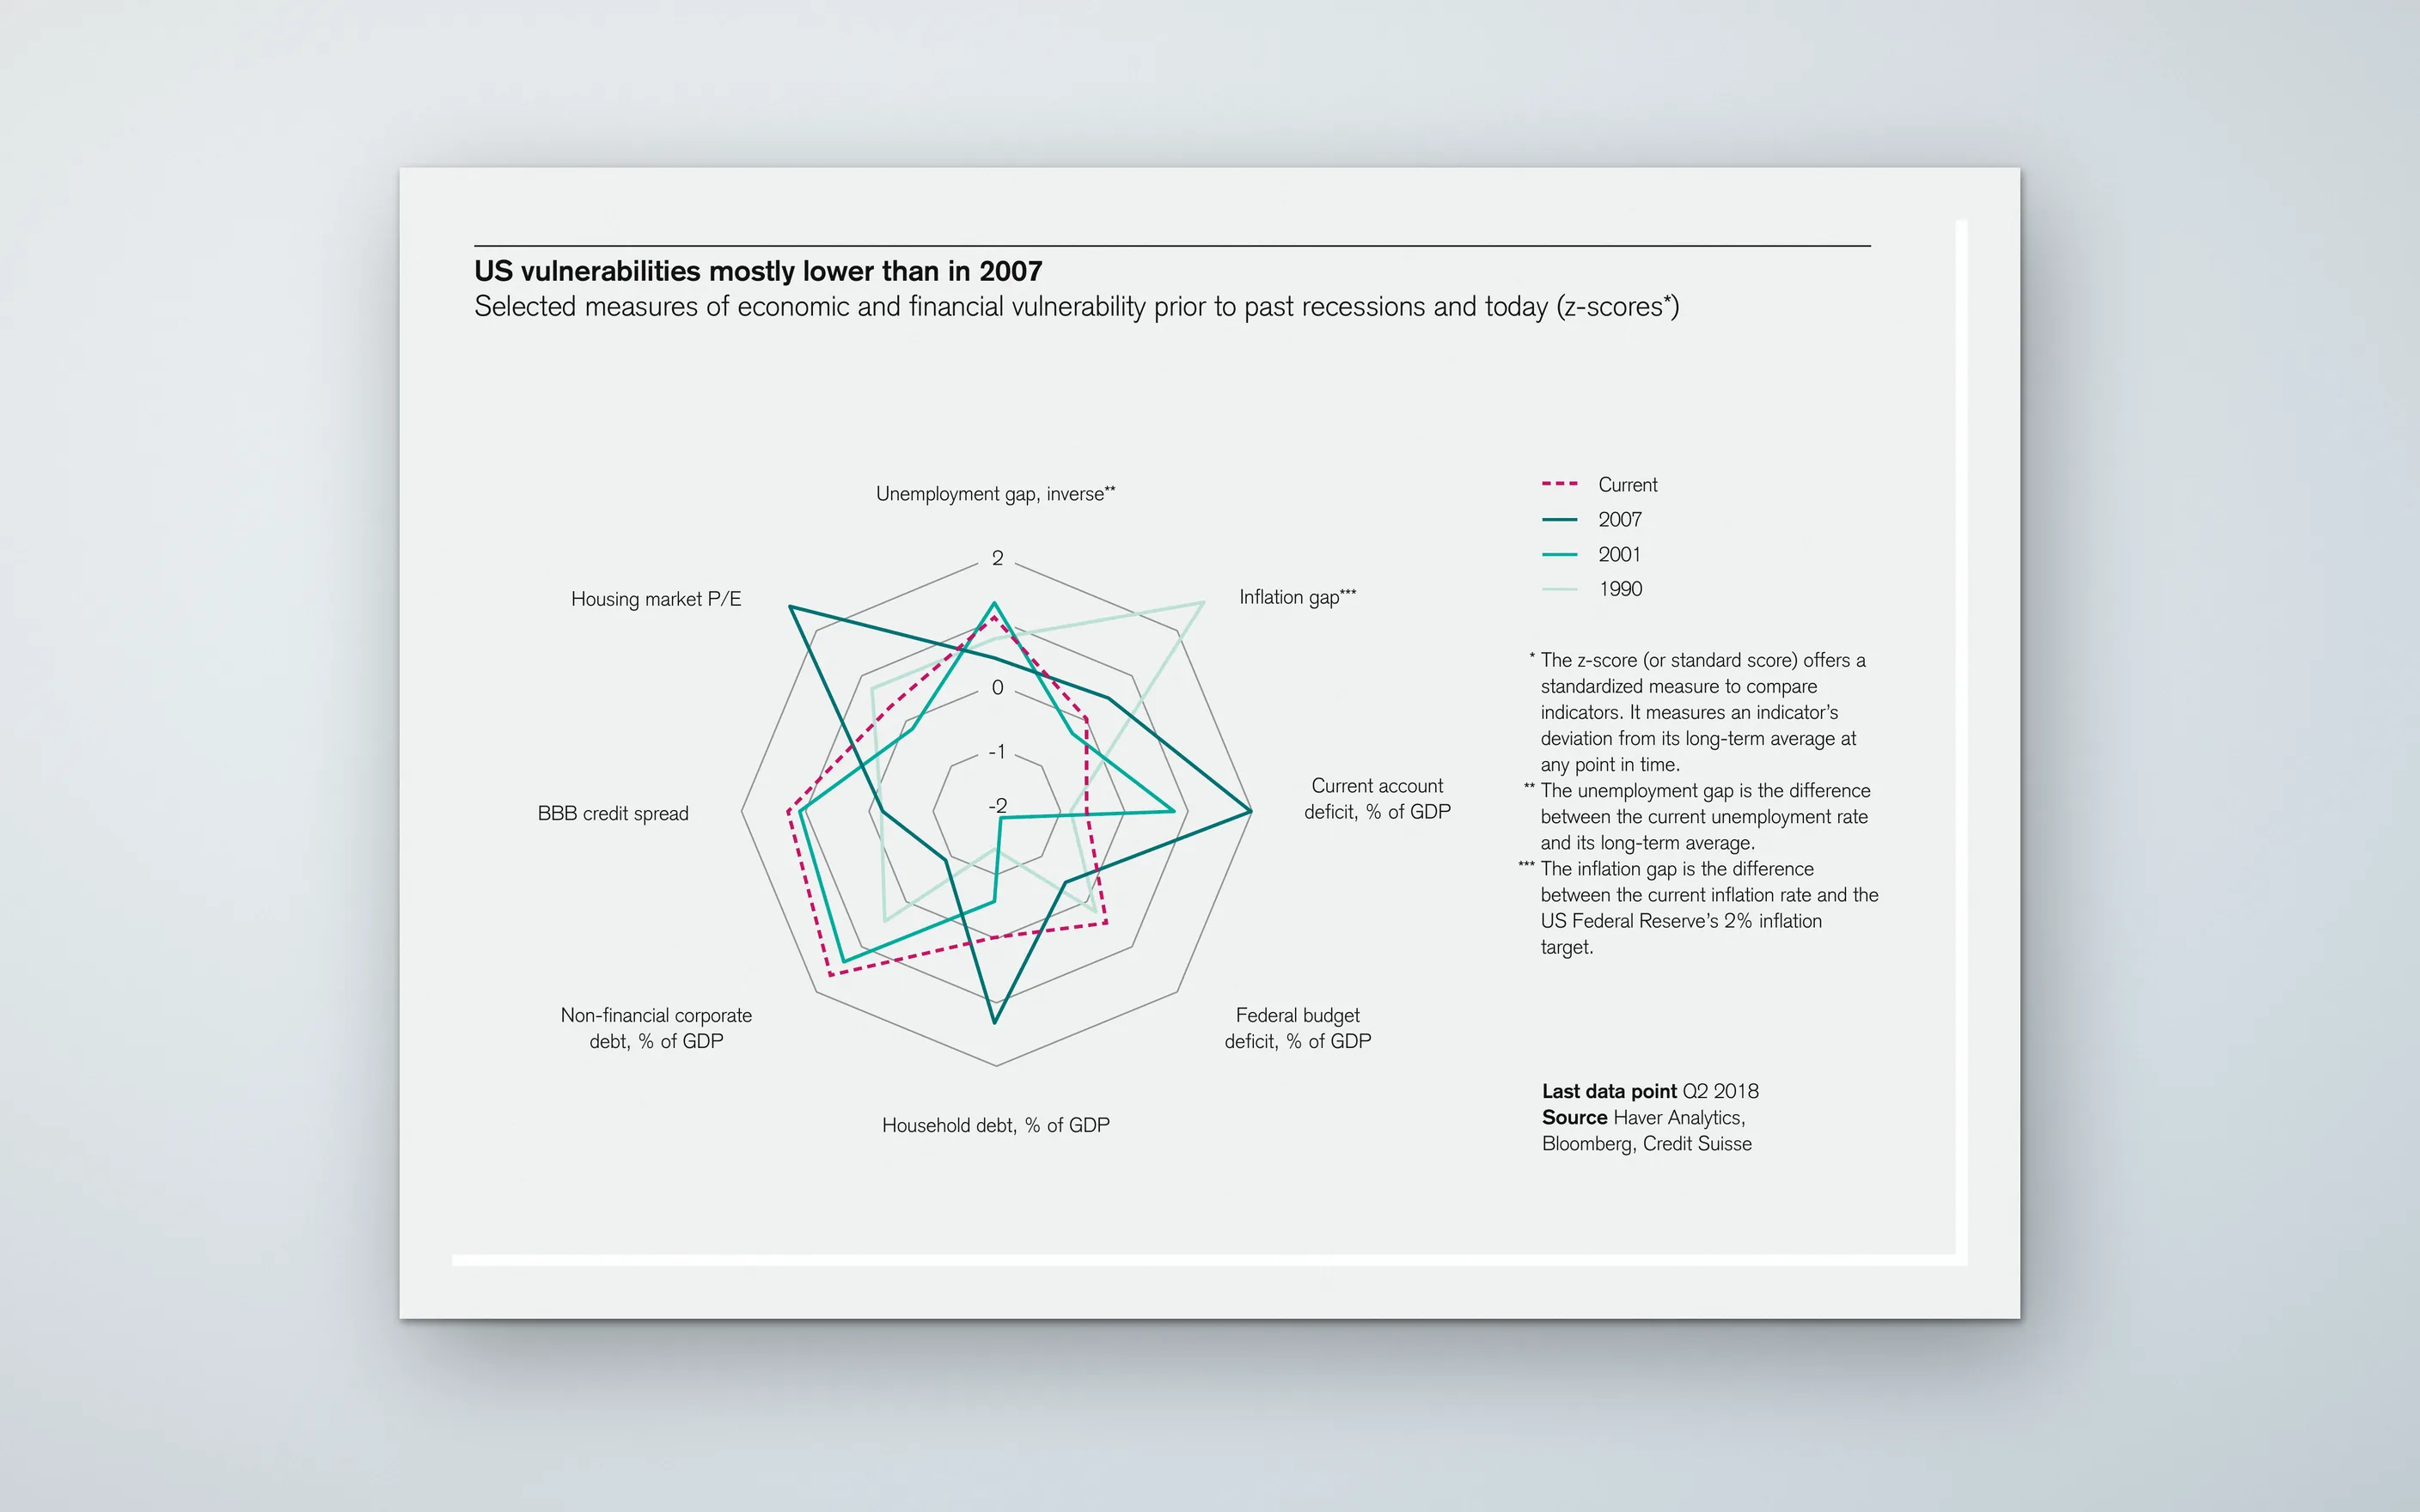
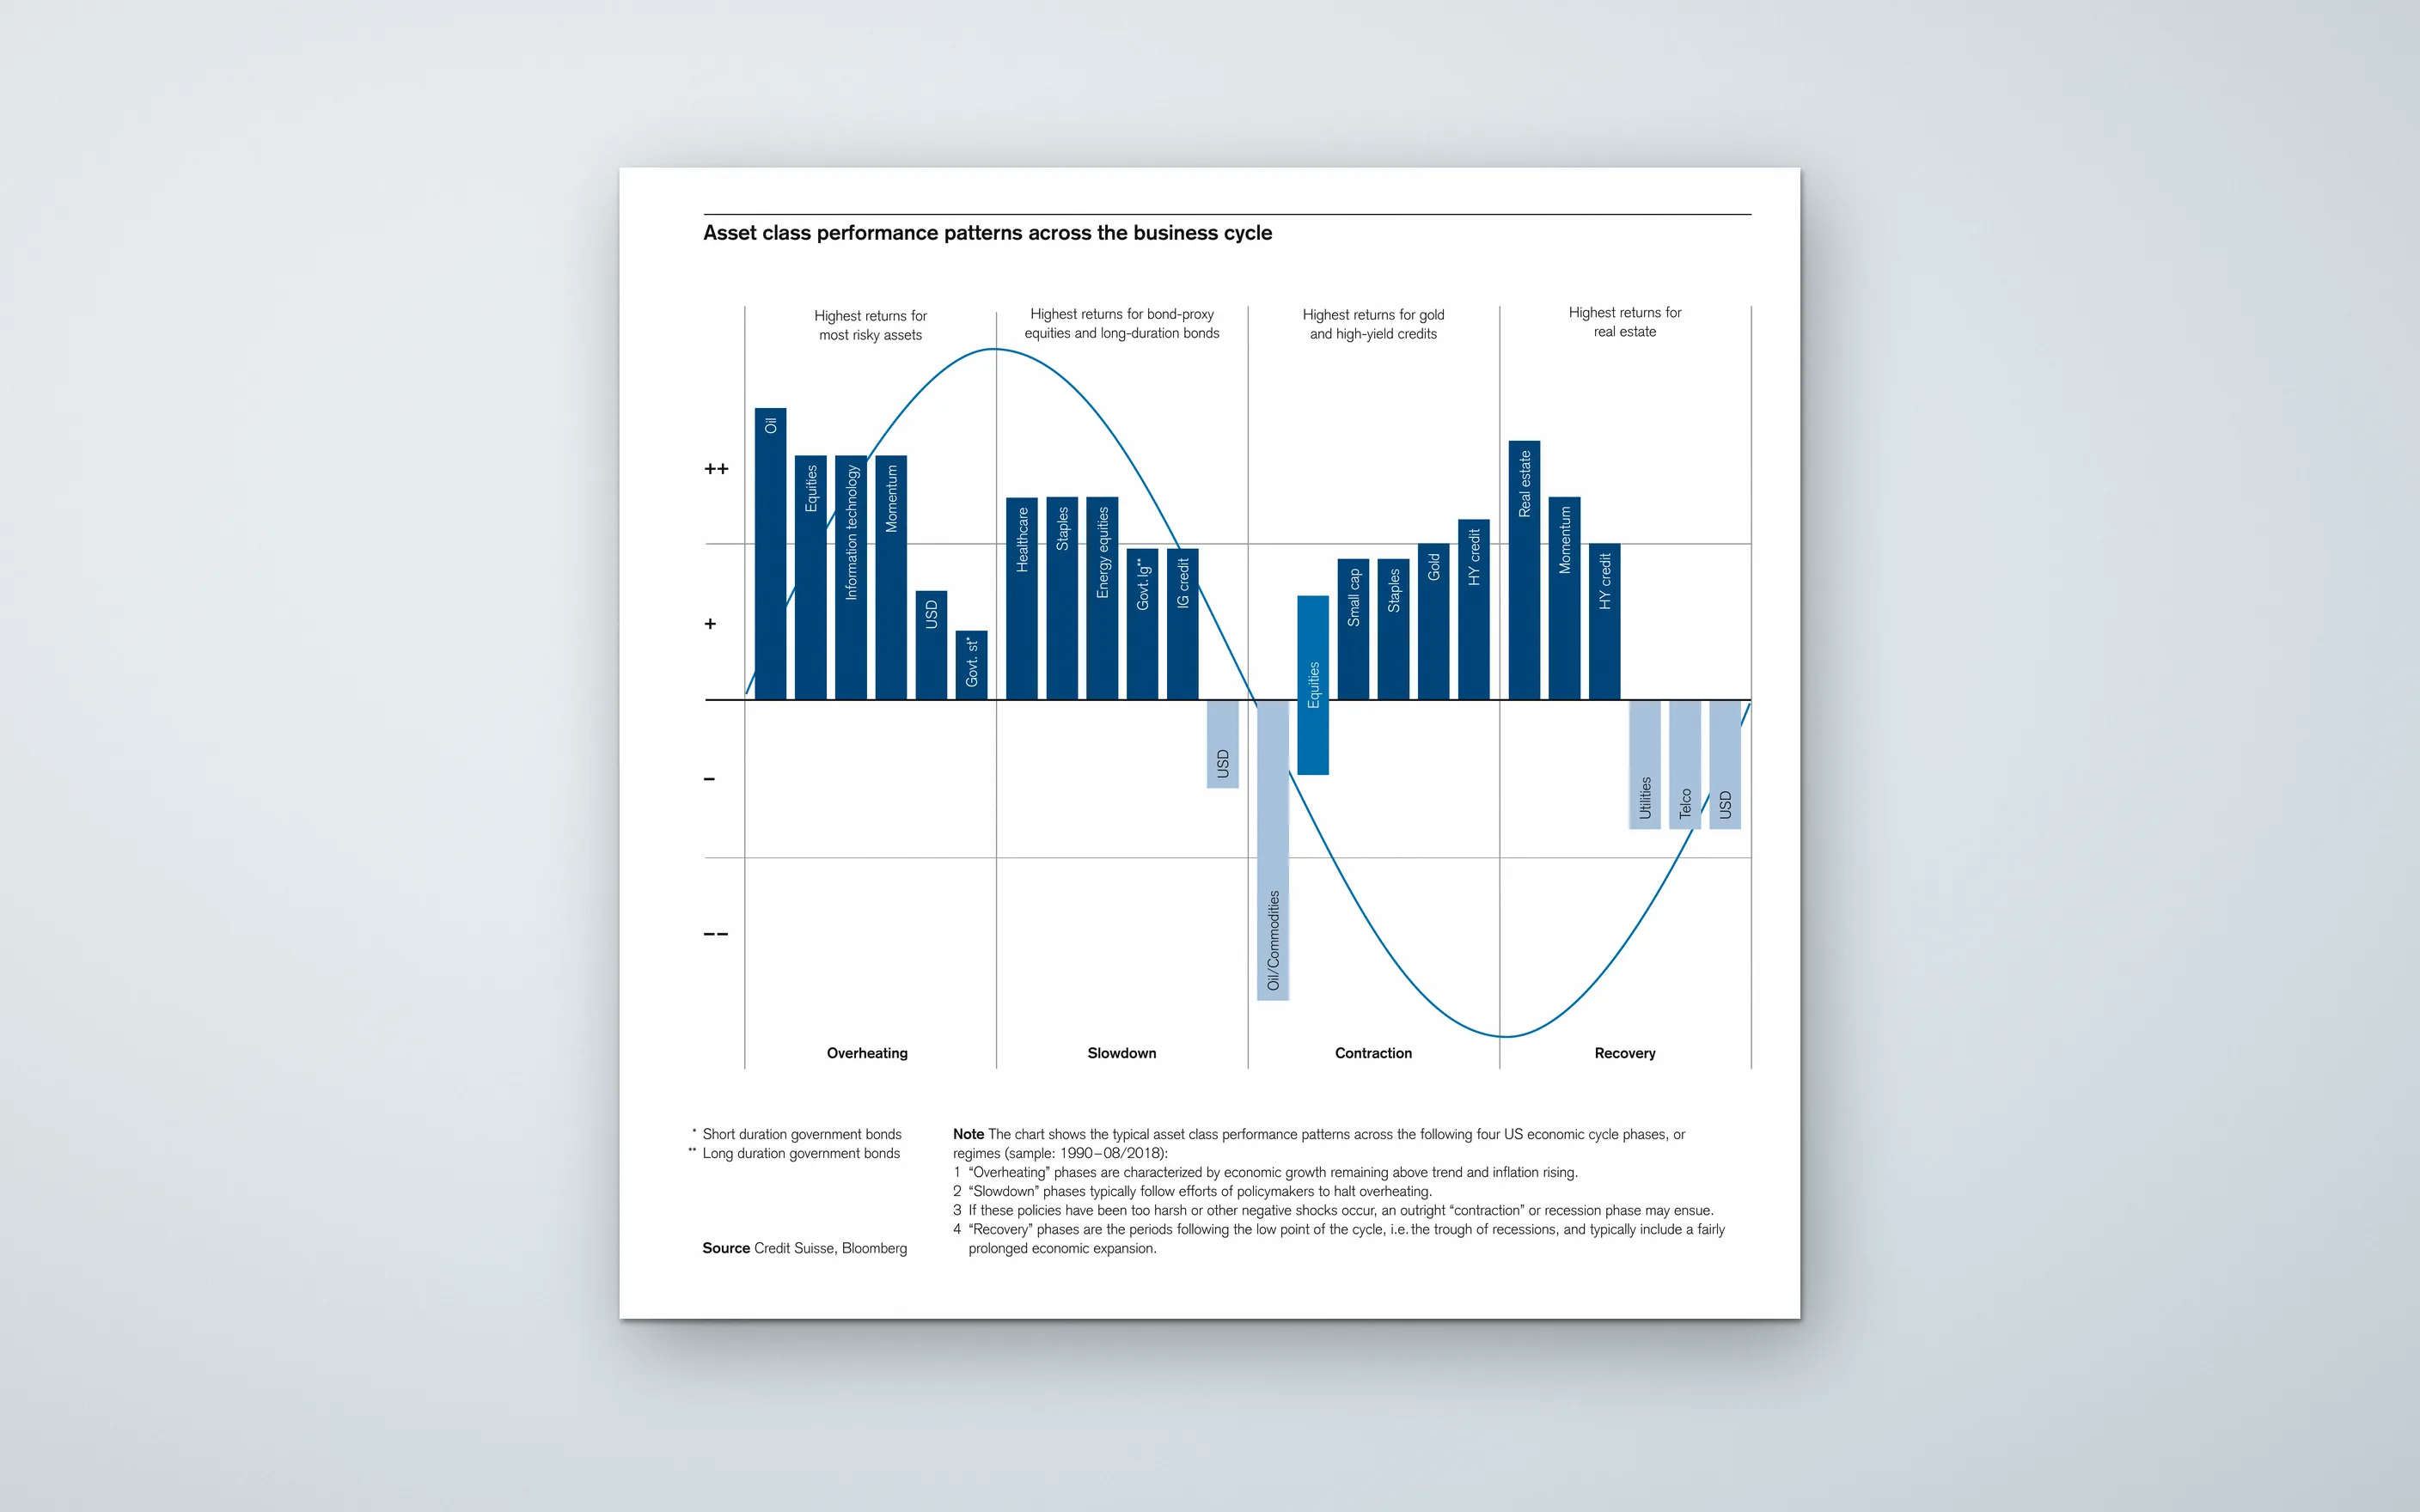
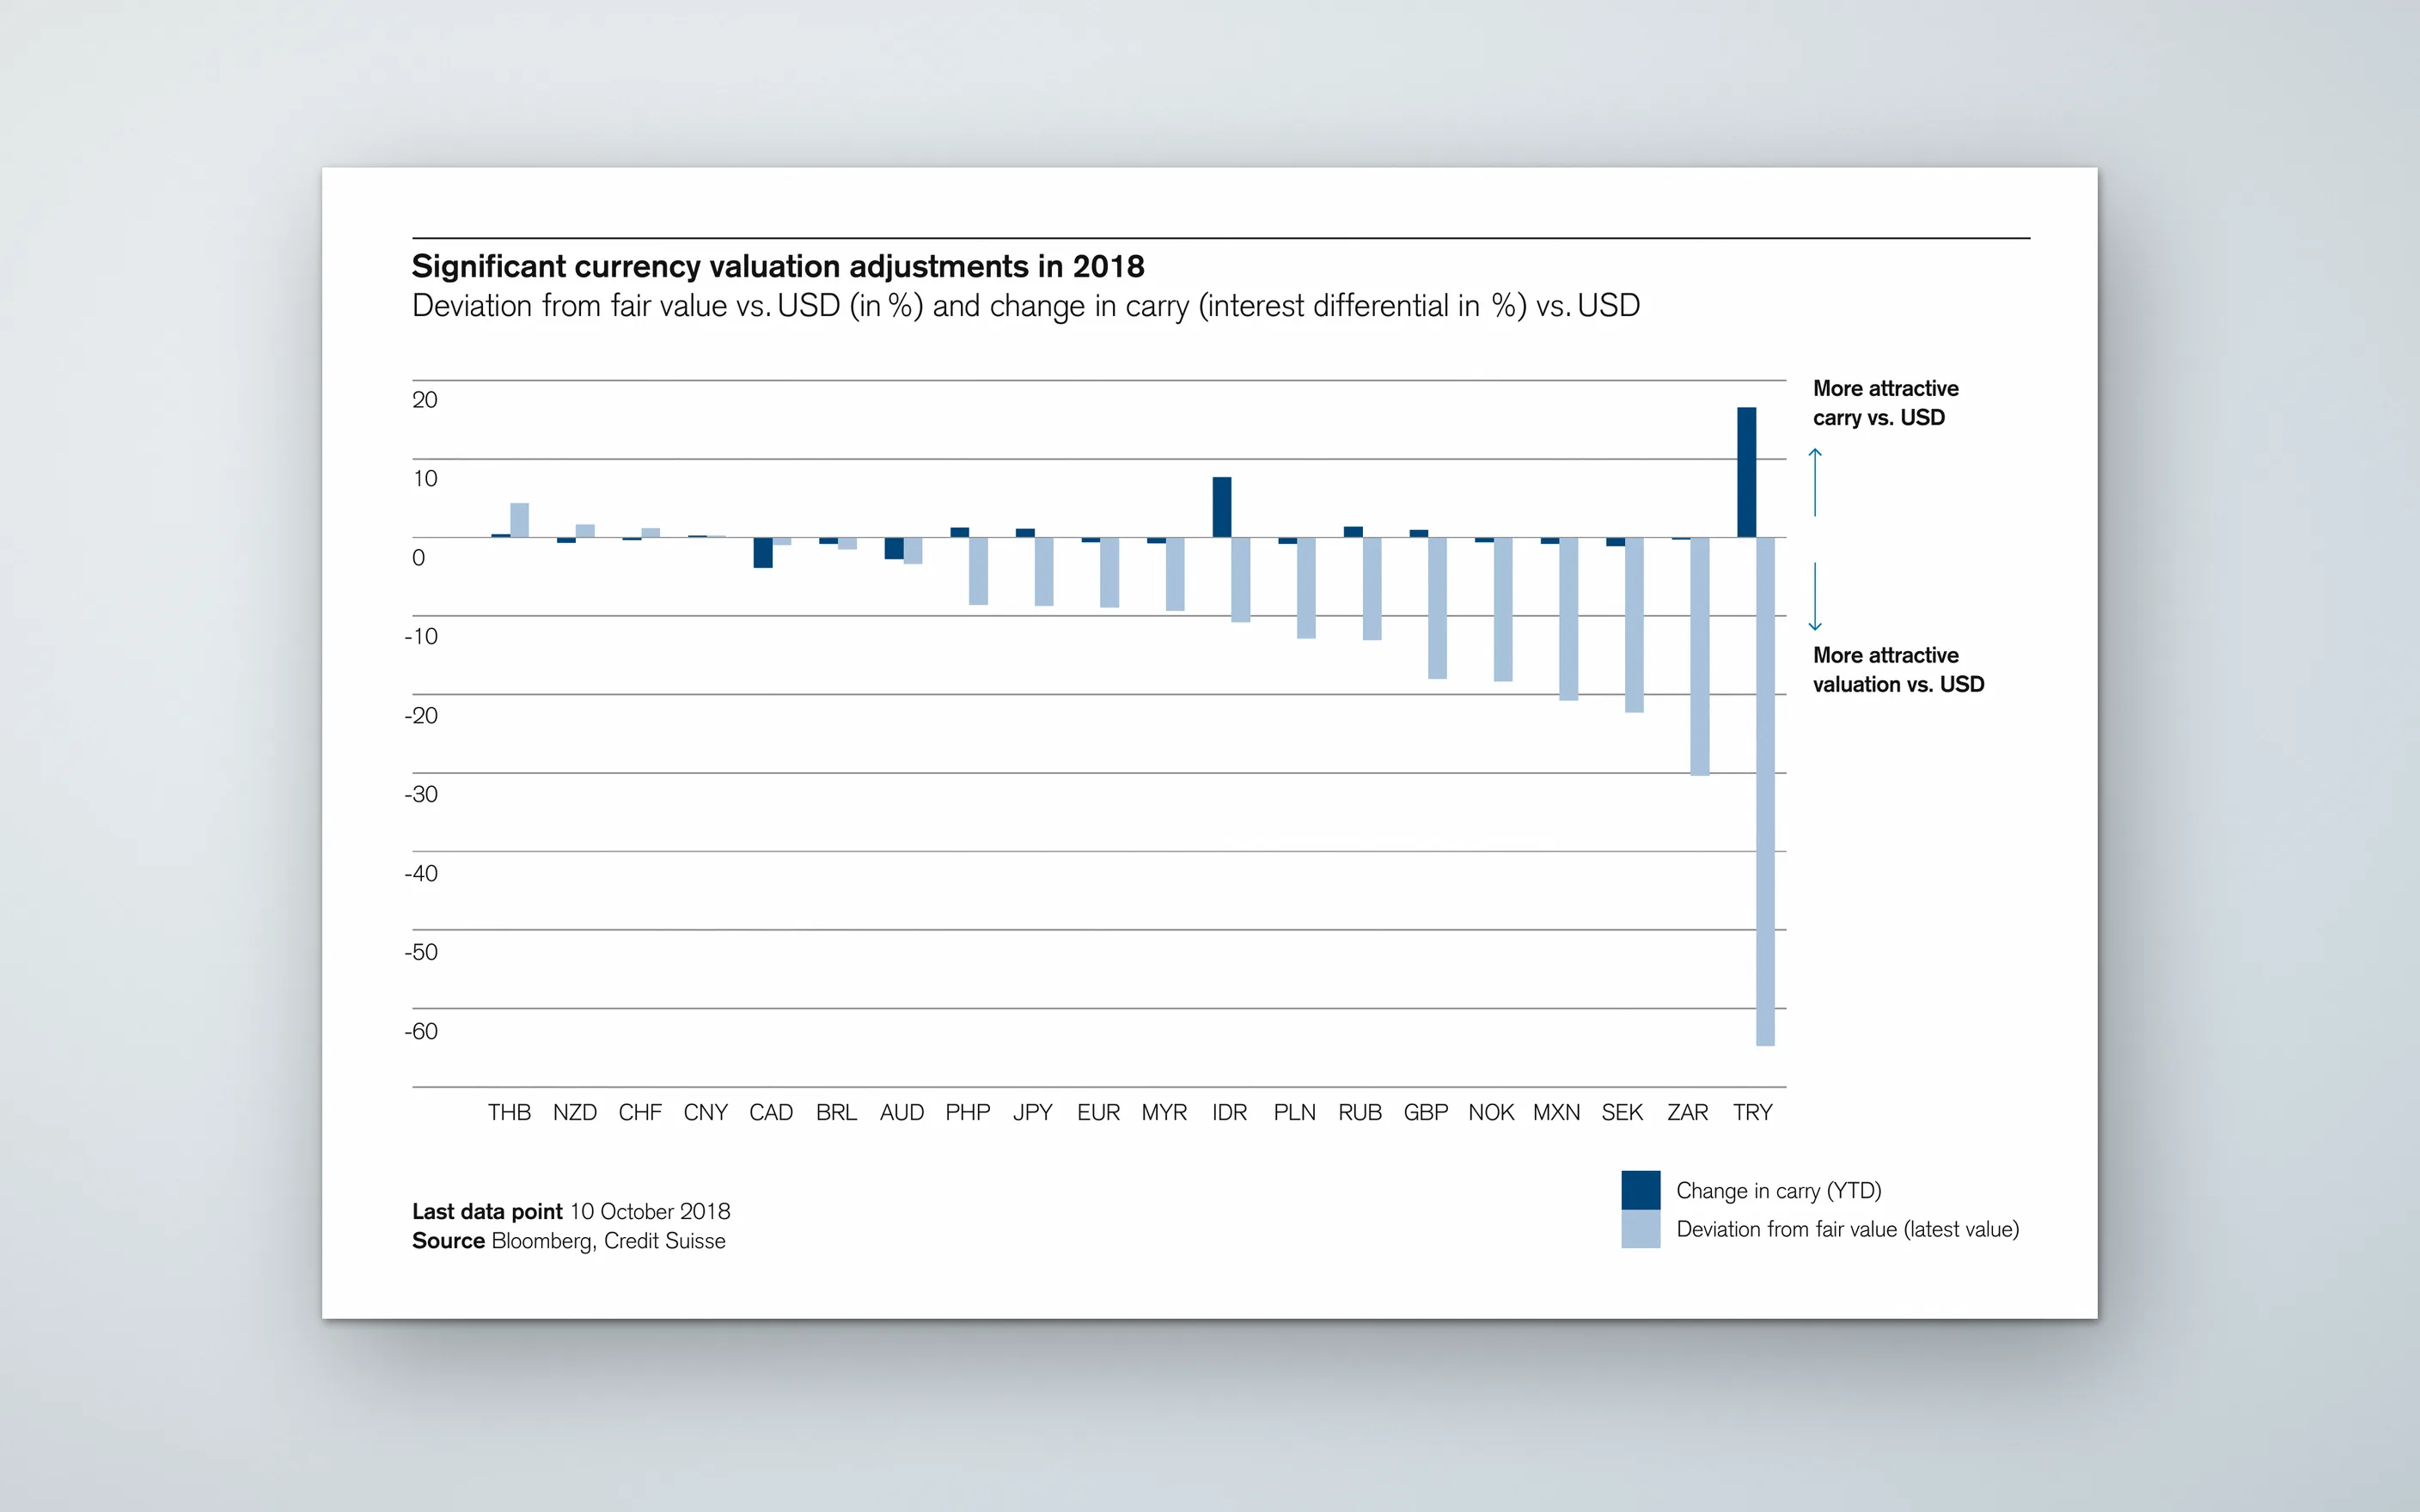
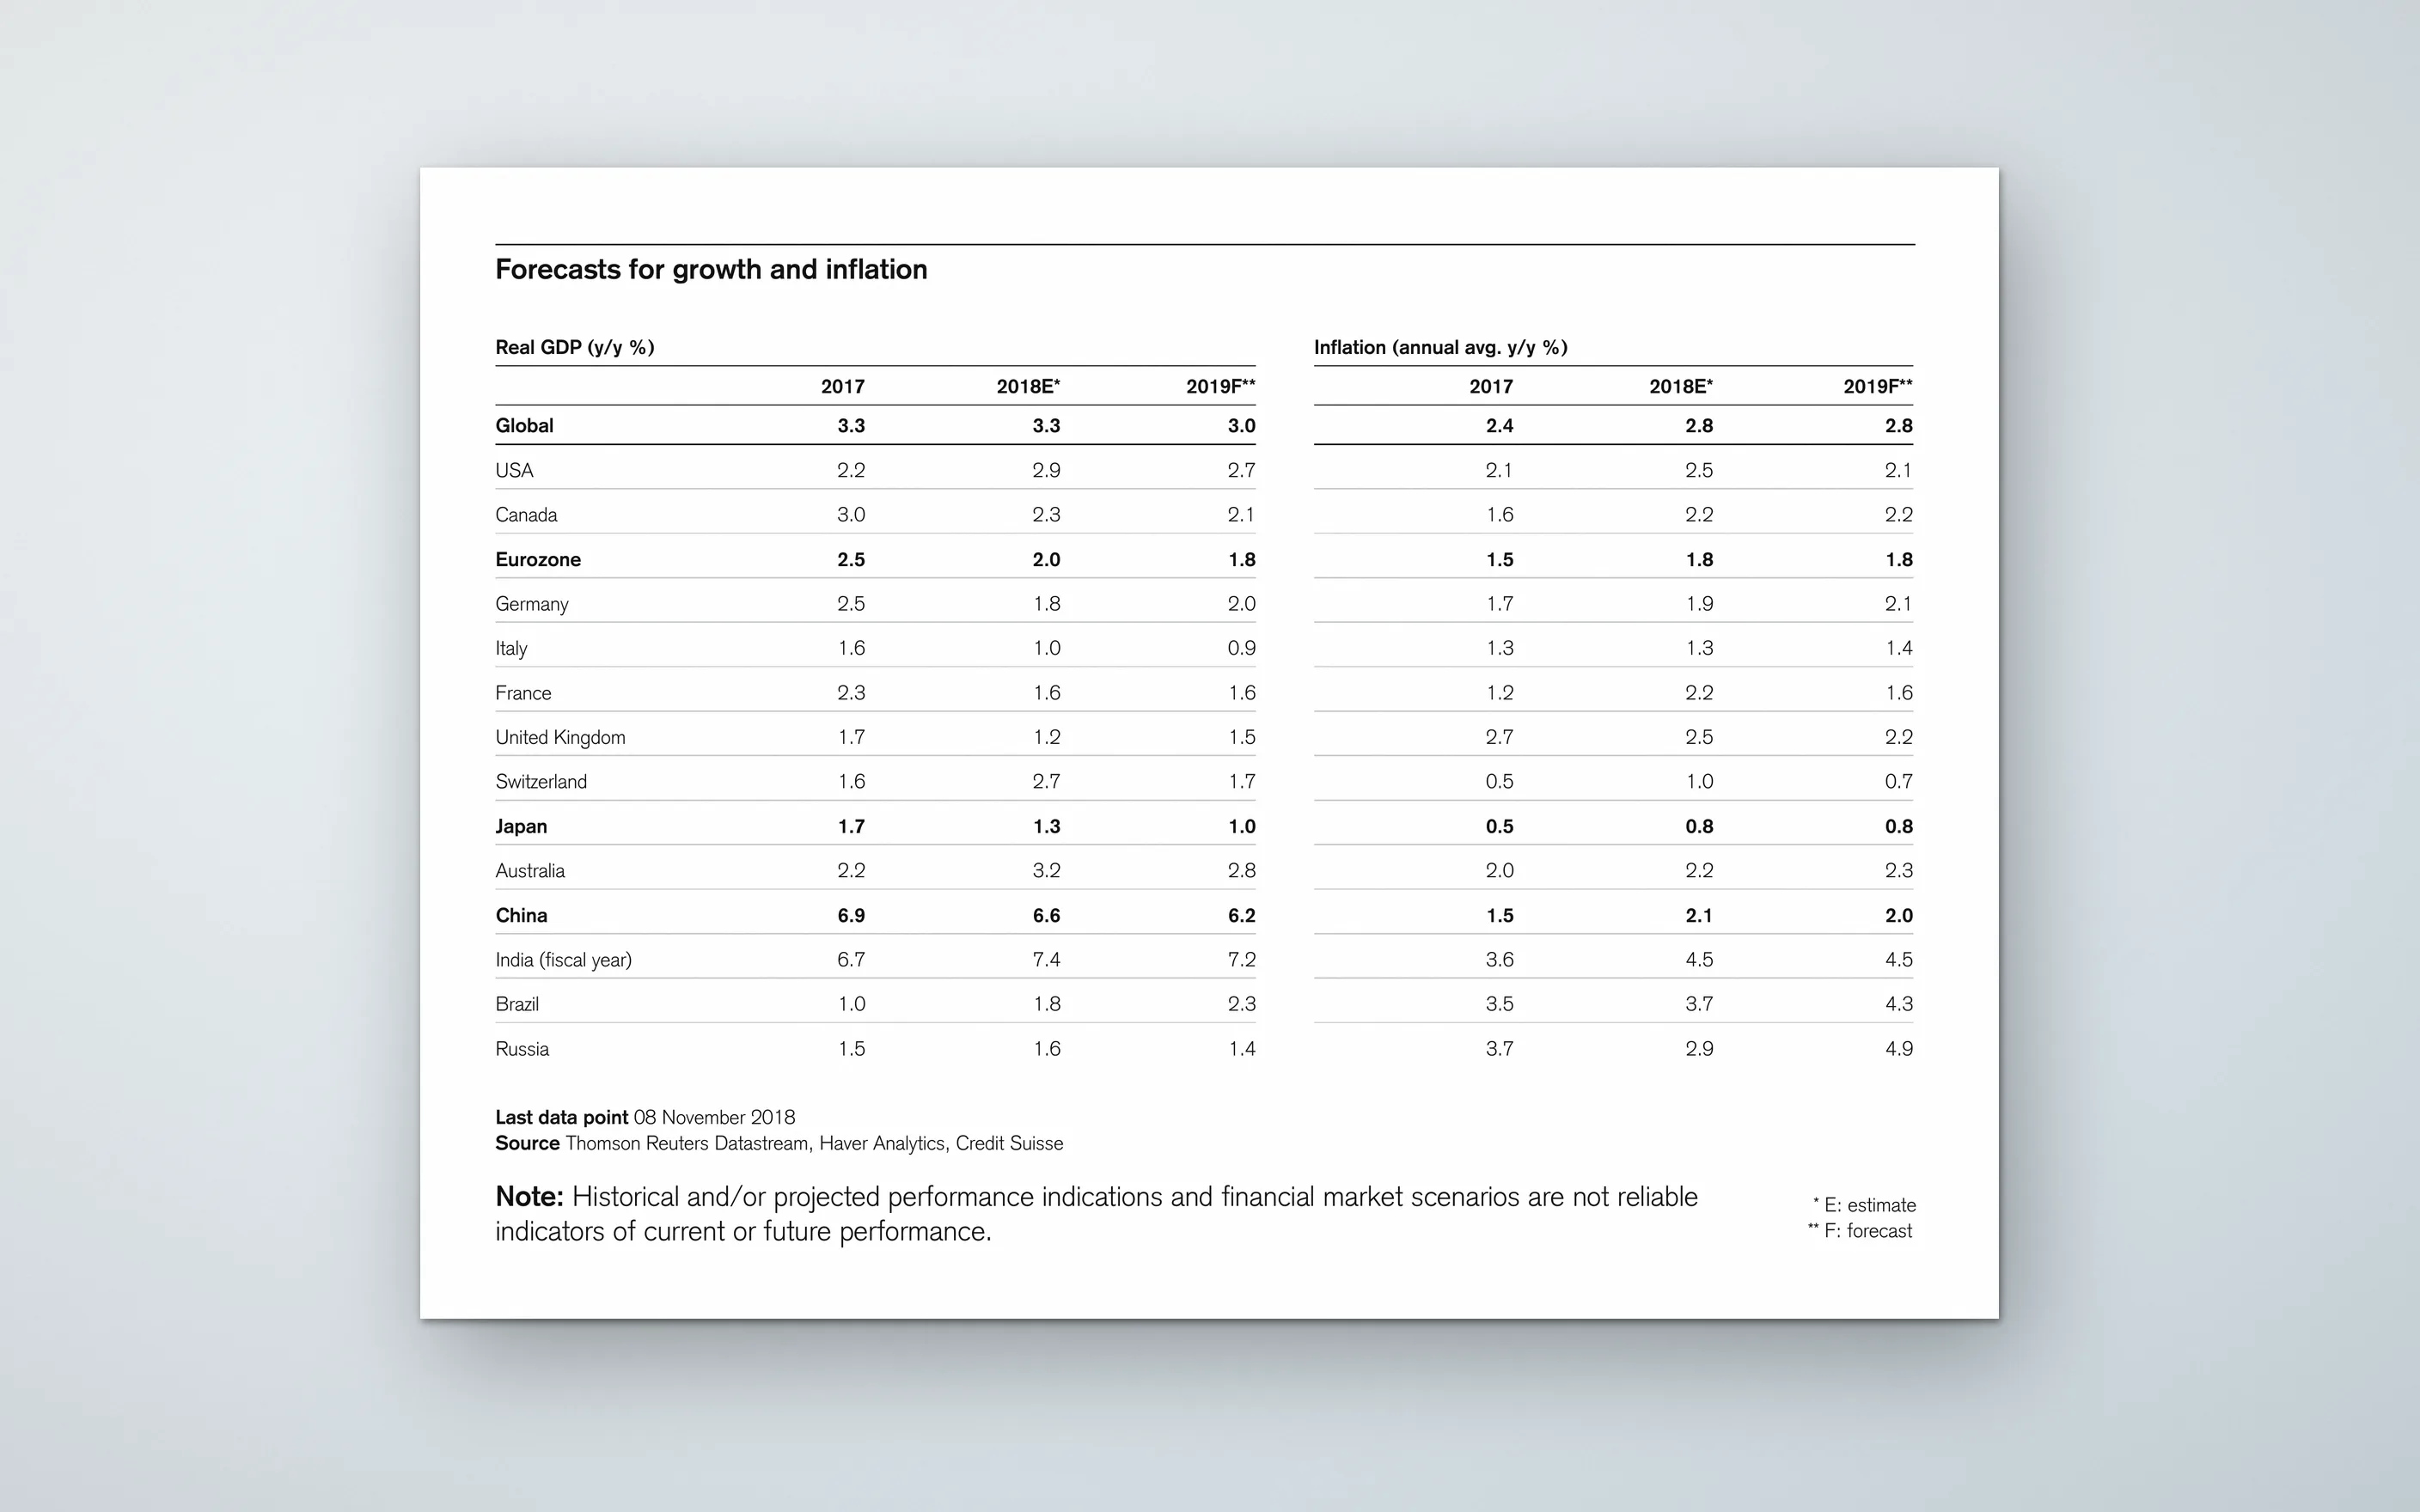
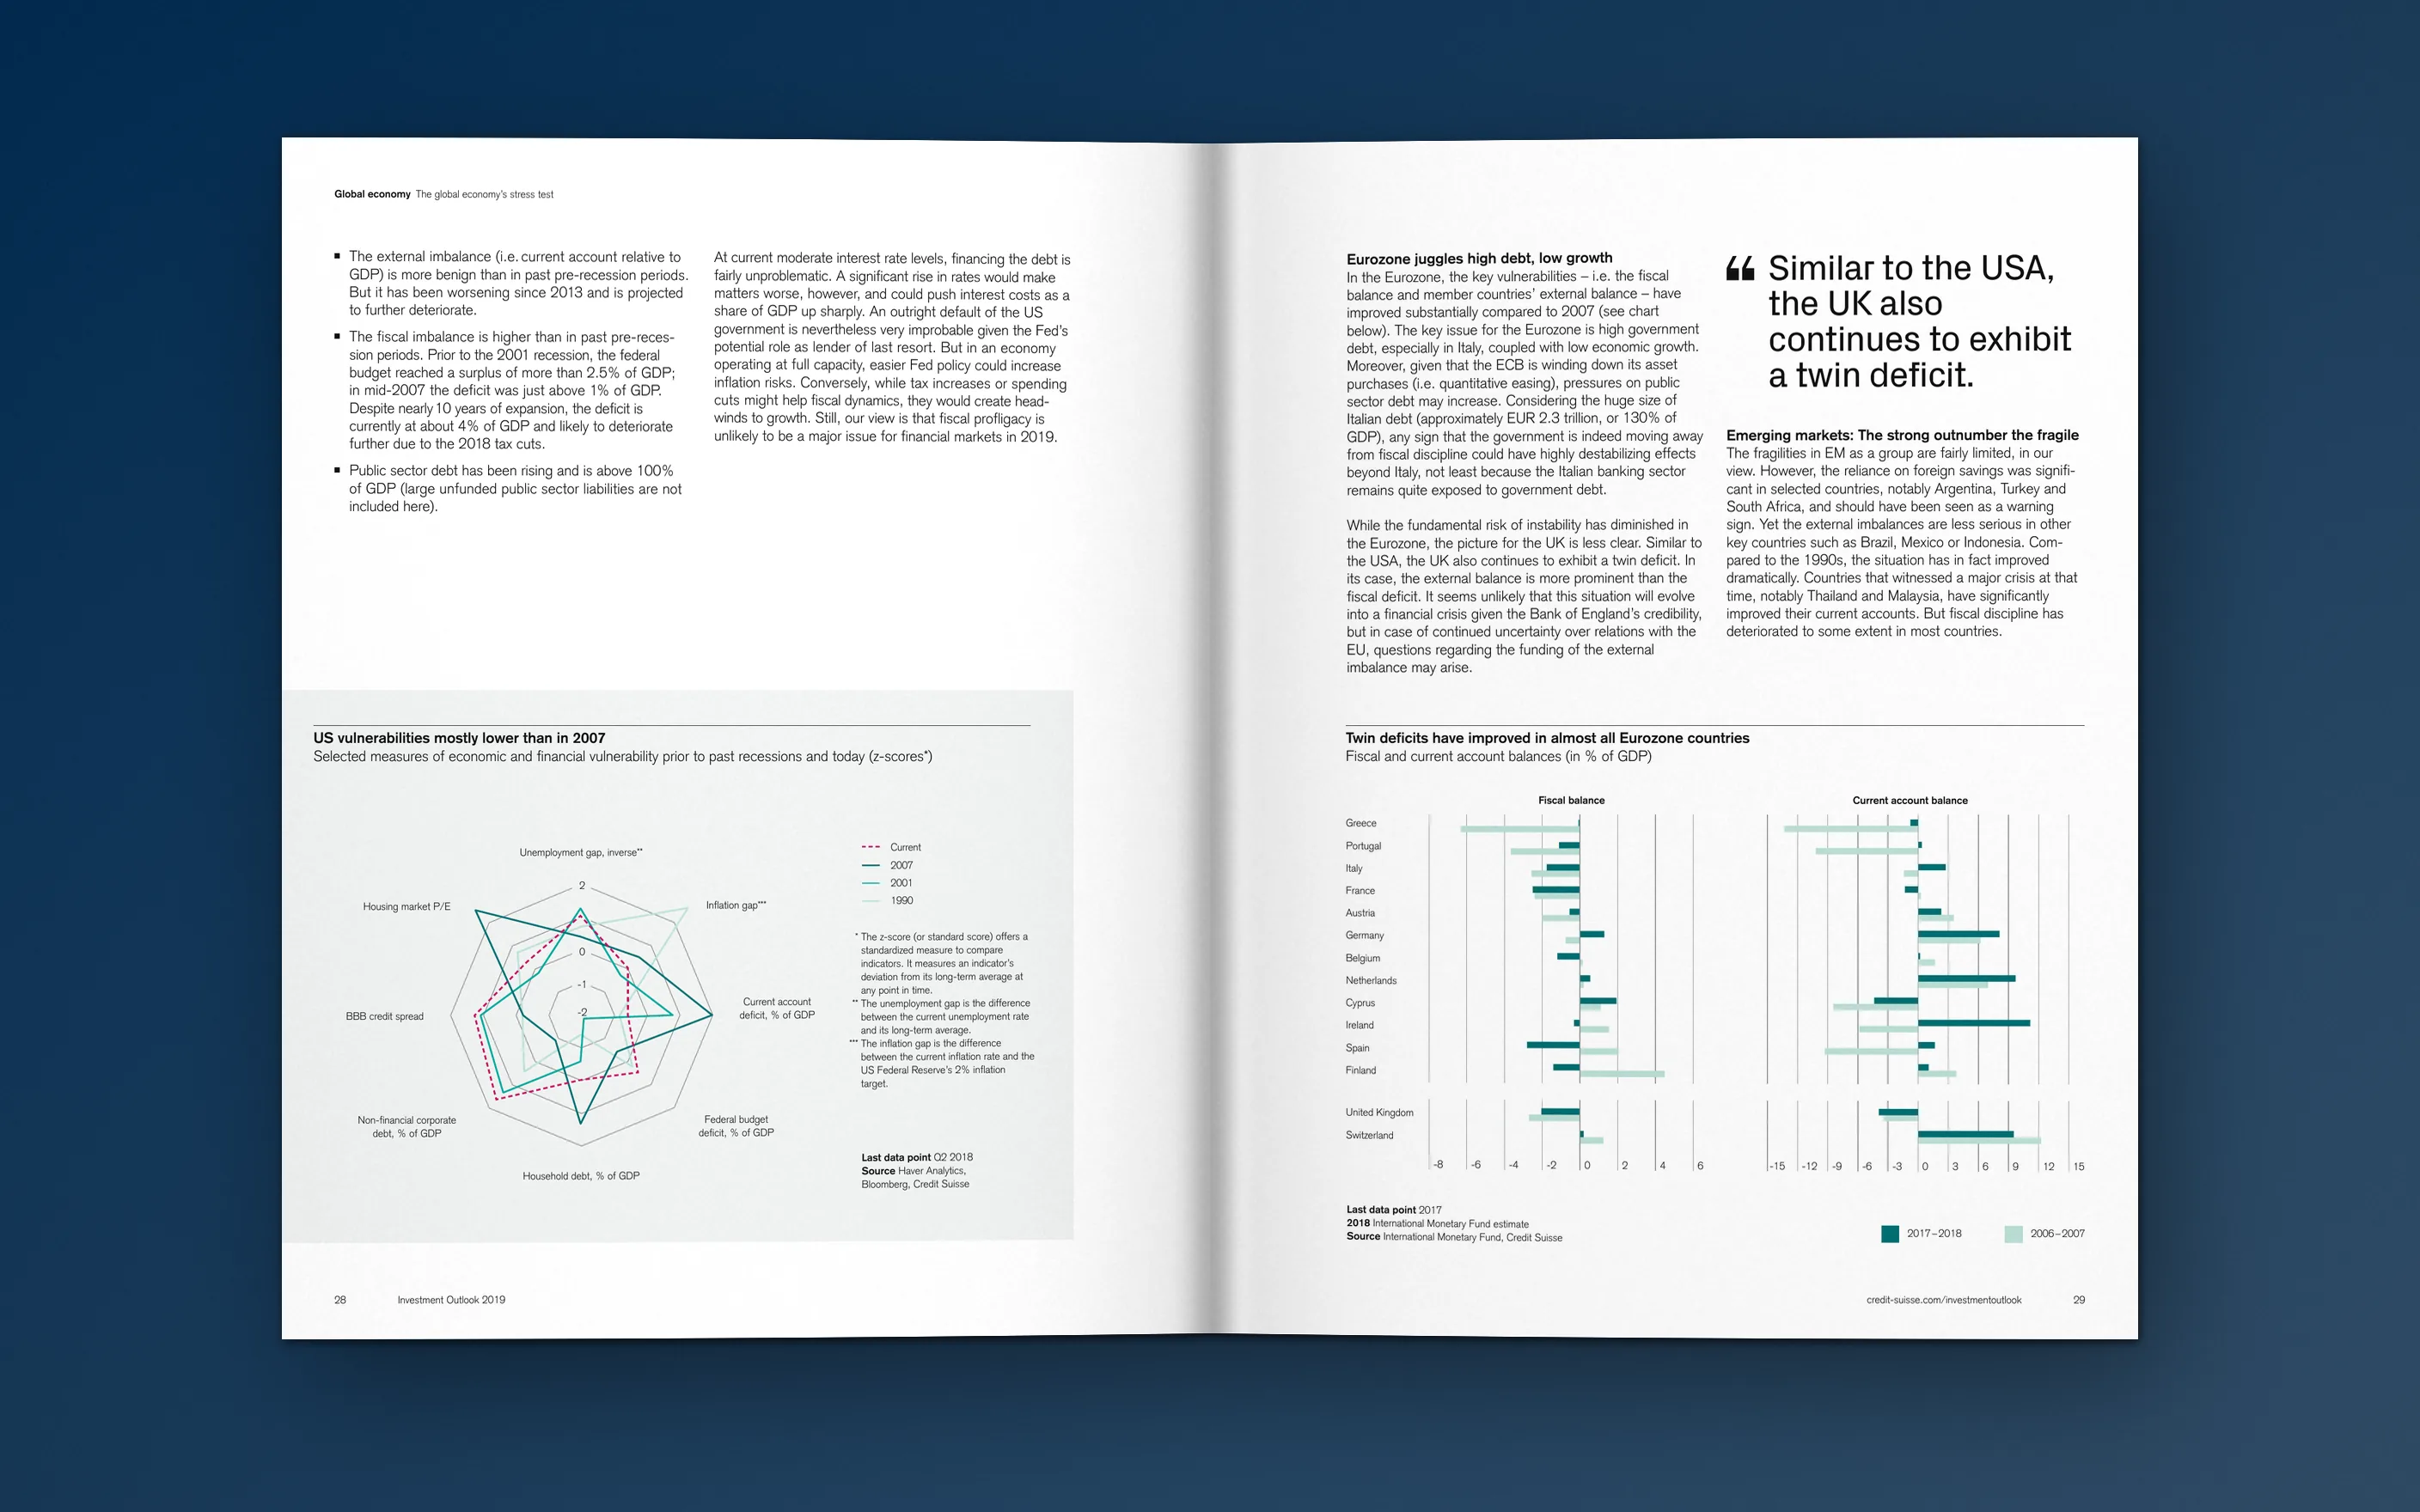
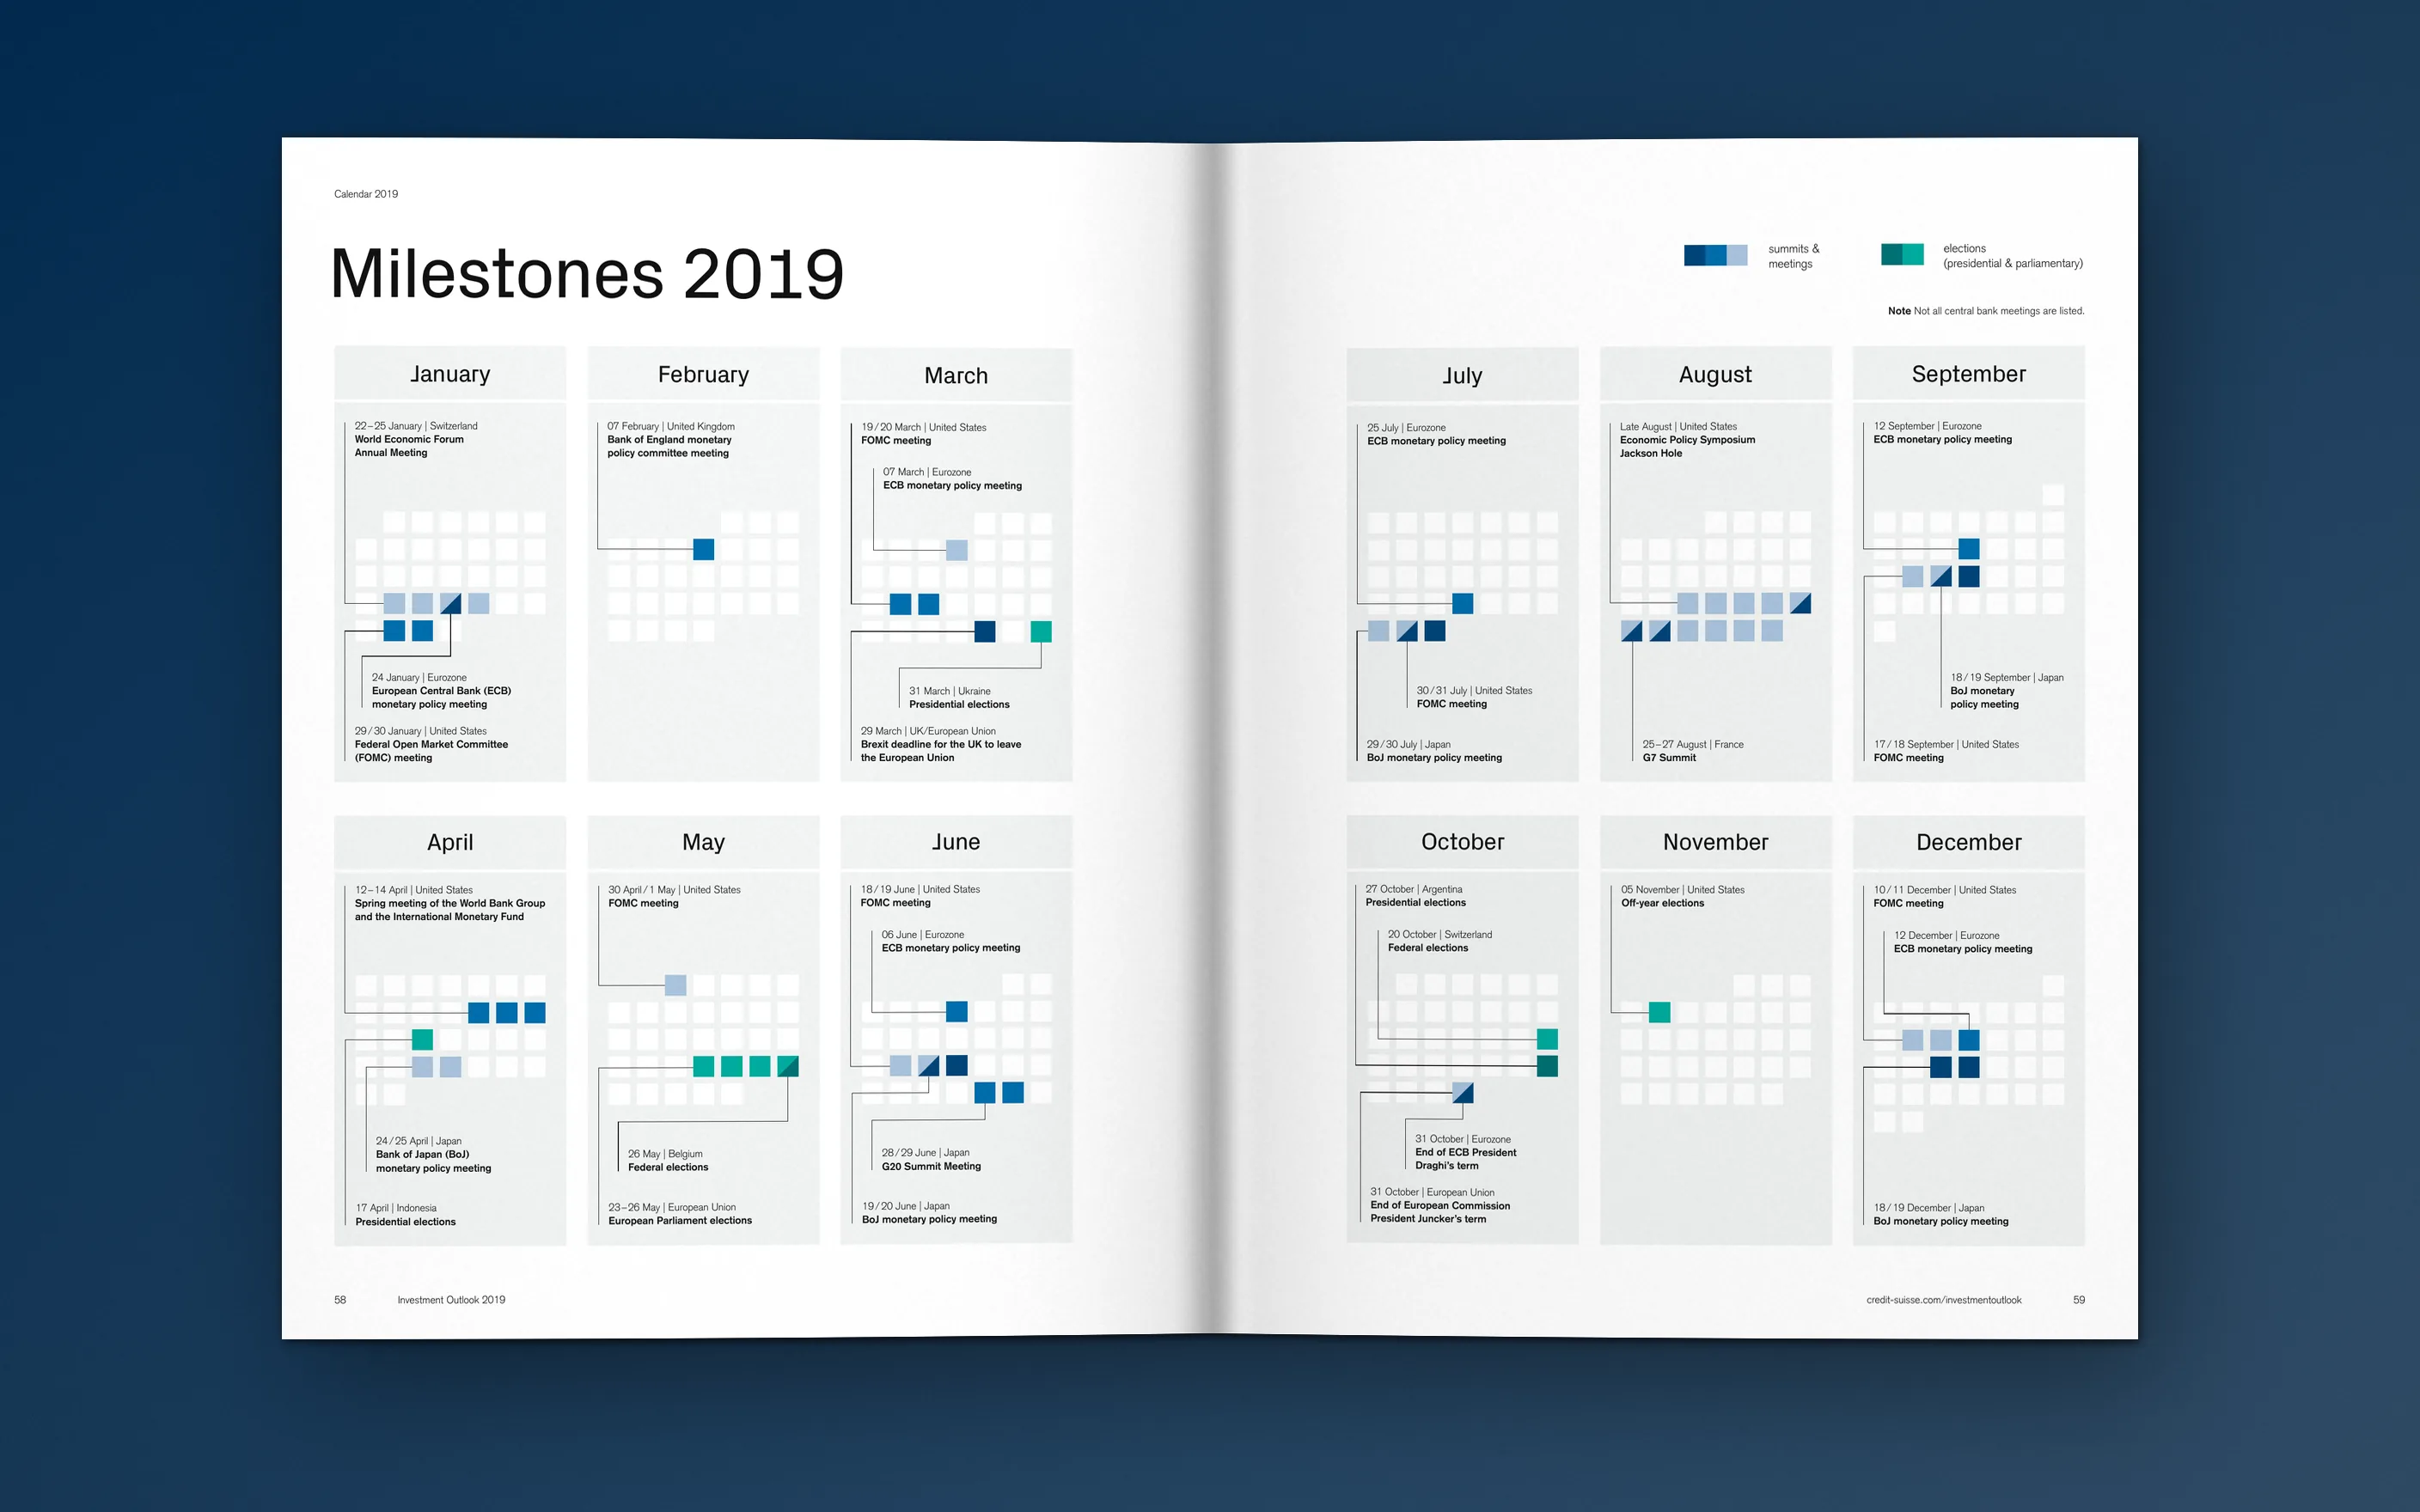
The report holds 23 charts, tables and infographics, from GDP and inflation forecasts to currency valuations and a spider chart comparing US vulnerabilities with past recessions. I built them as one consistent system with shared colours, type sizes, axes and source lines, so complex data from the Credit Suisse economists reads the same way on every page.
2018 at a glance
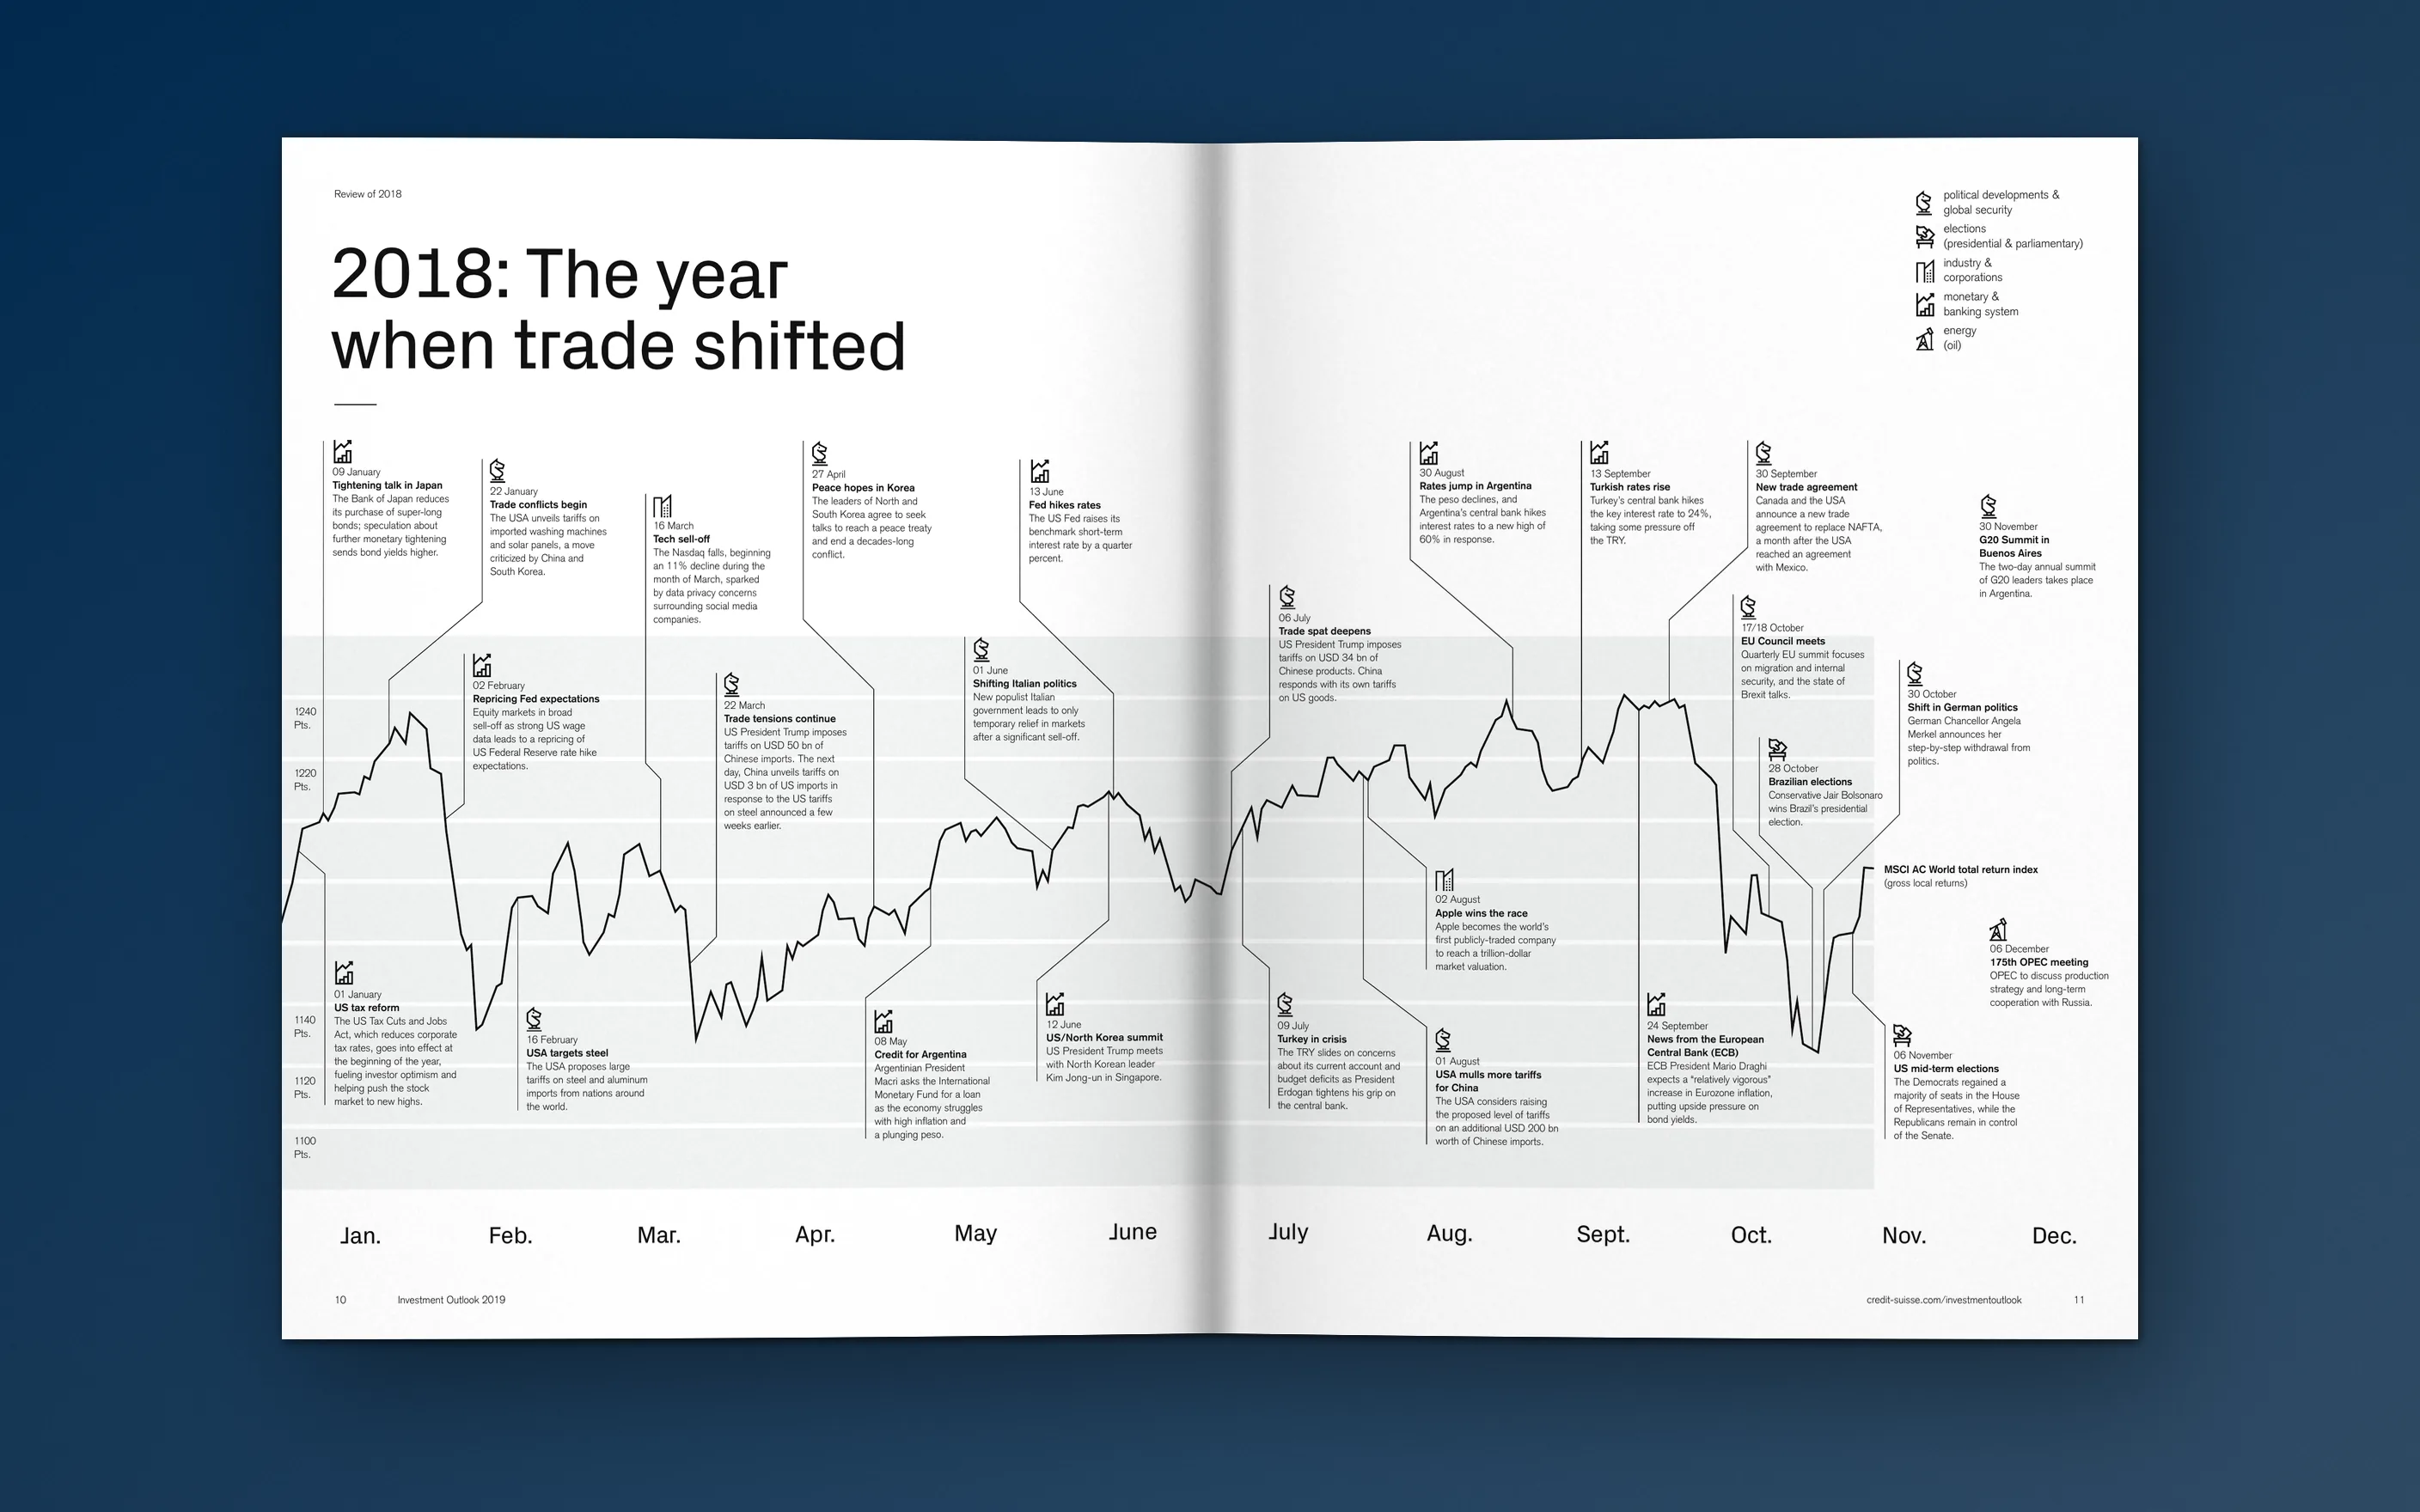
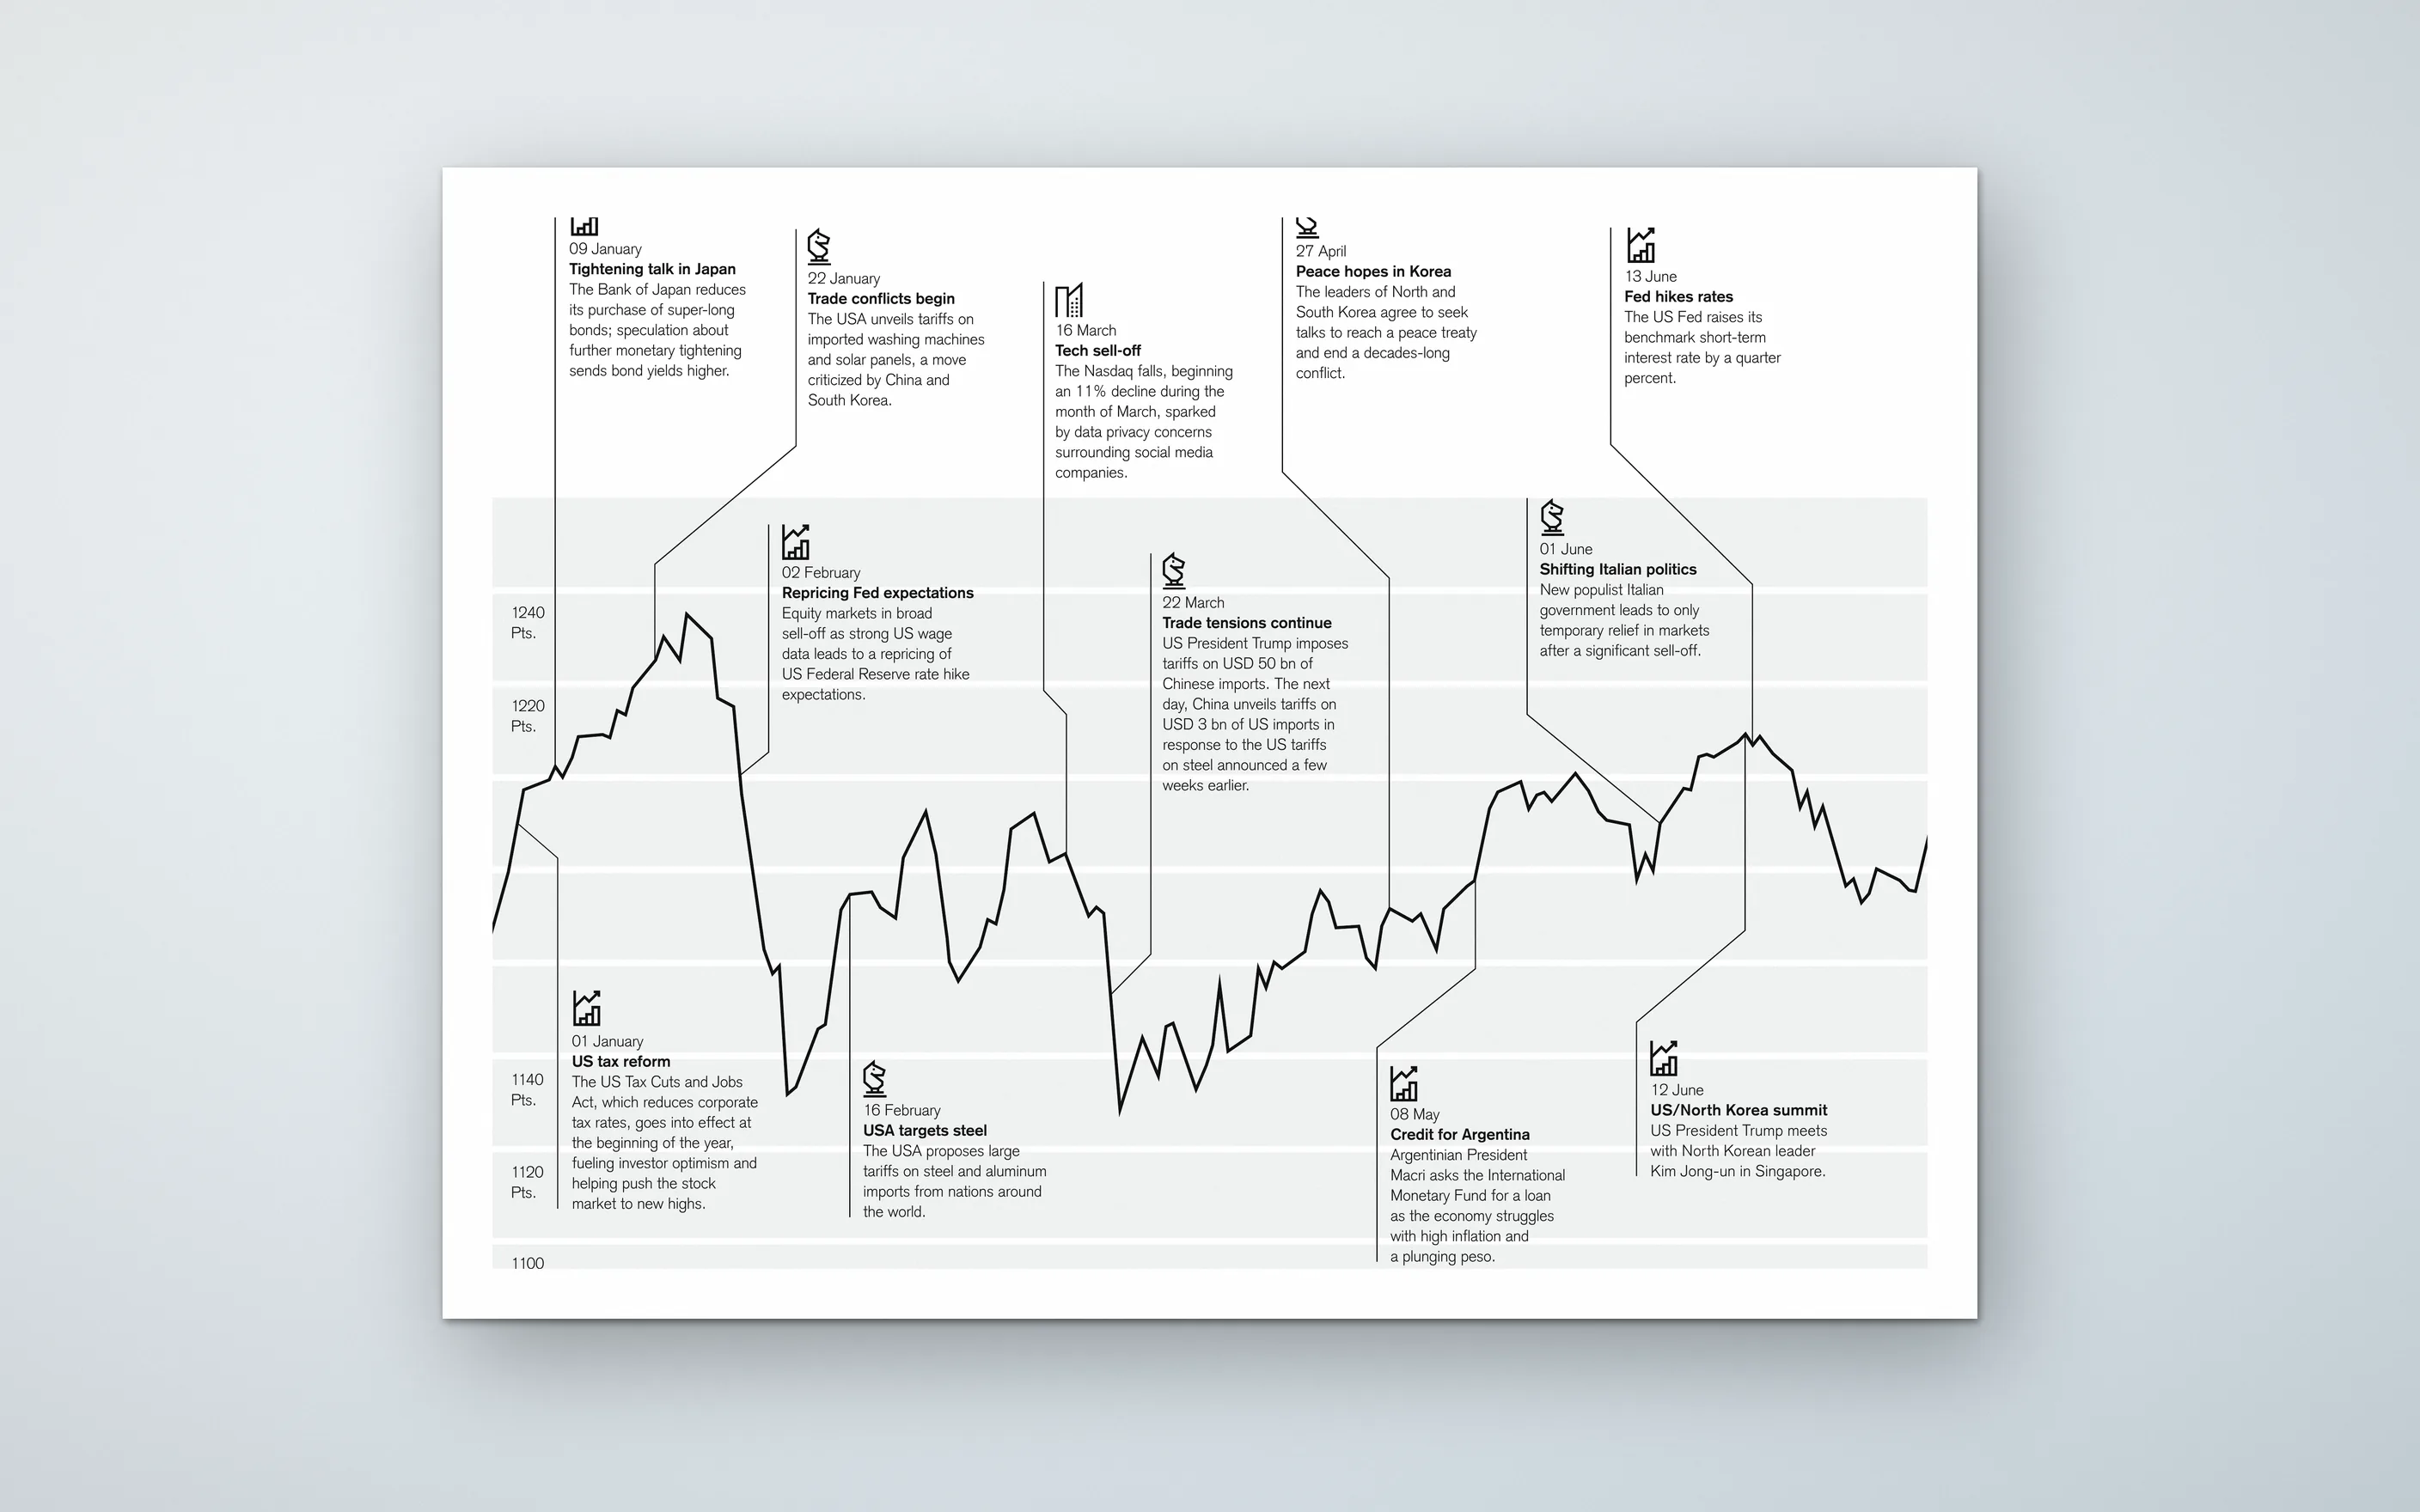
The Review of 2018 spread turns a full year of markets into a single timeline. Key events, from the first US tariffs to the G20 summit in Buenos Aires, sit along the MSCI AC World index, each marked with an icon for one of five themes: politics and security, elections, industry, monetary policy and energy. One spread that tells the whole year.
Regions in focus
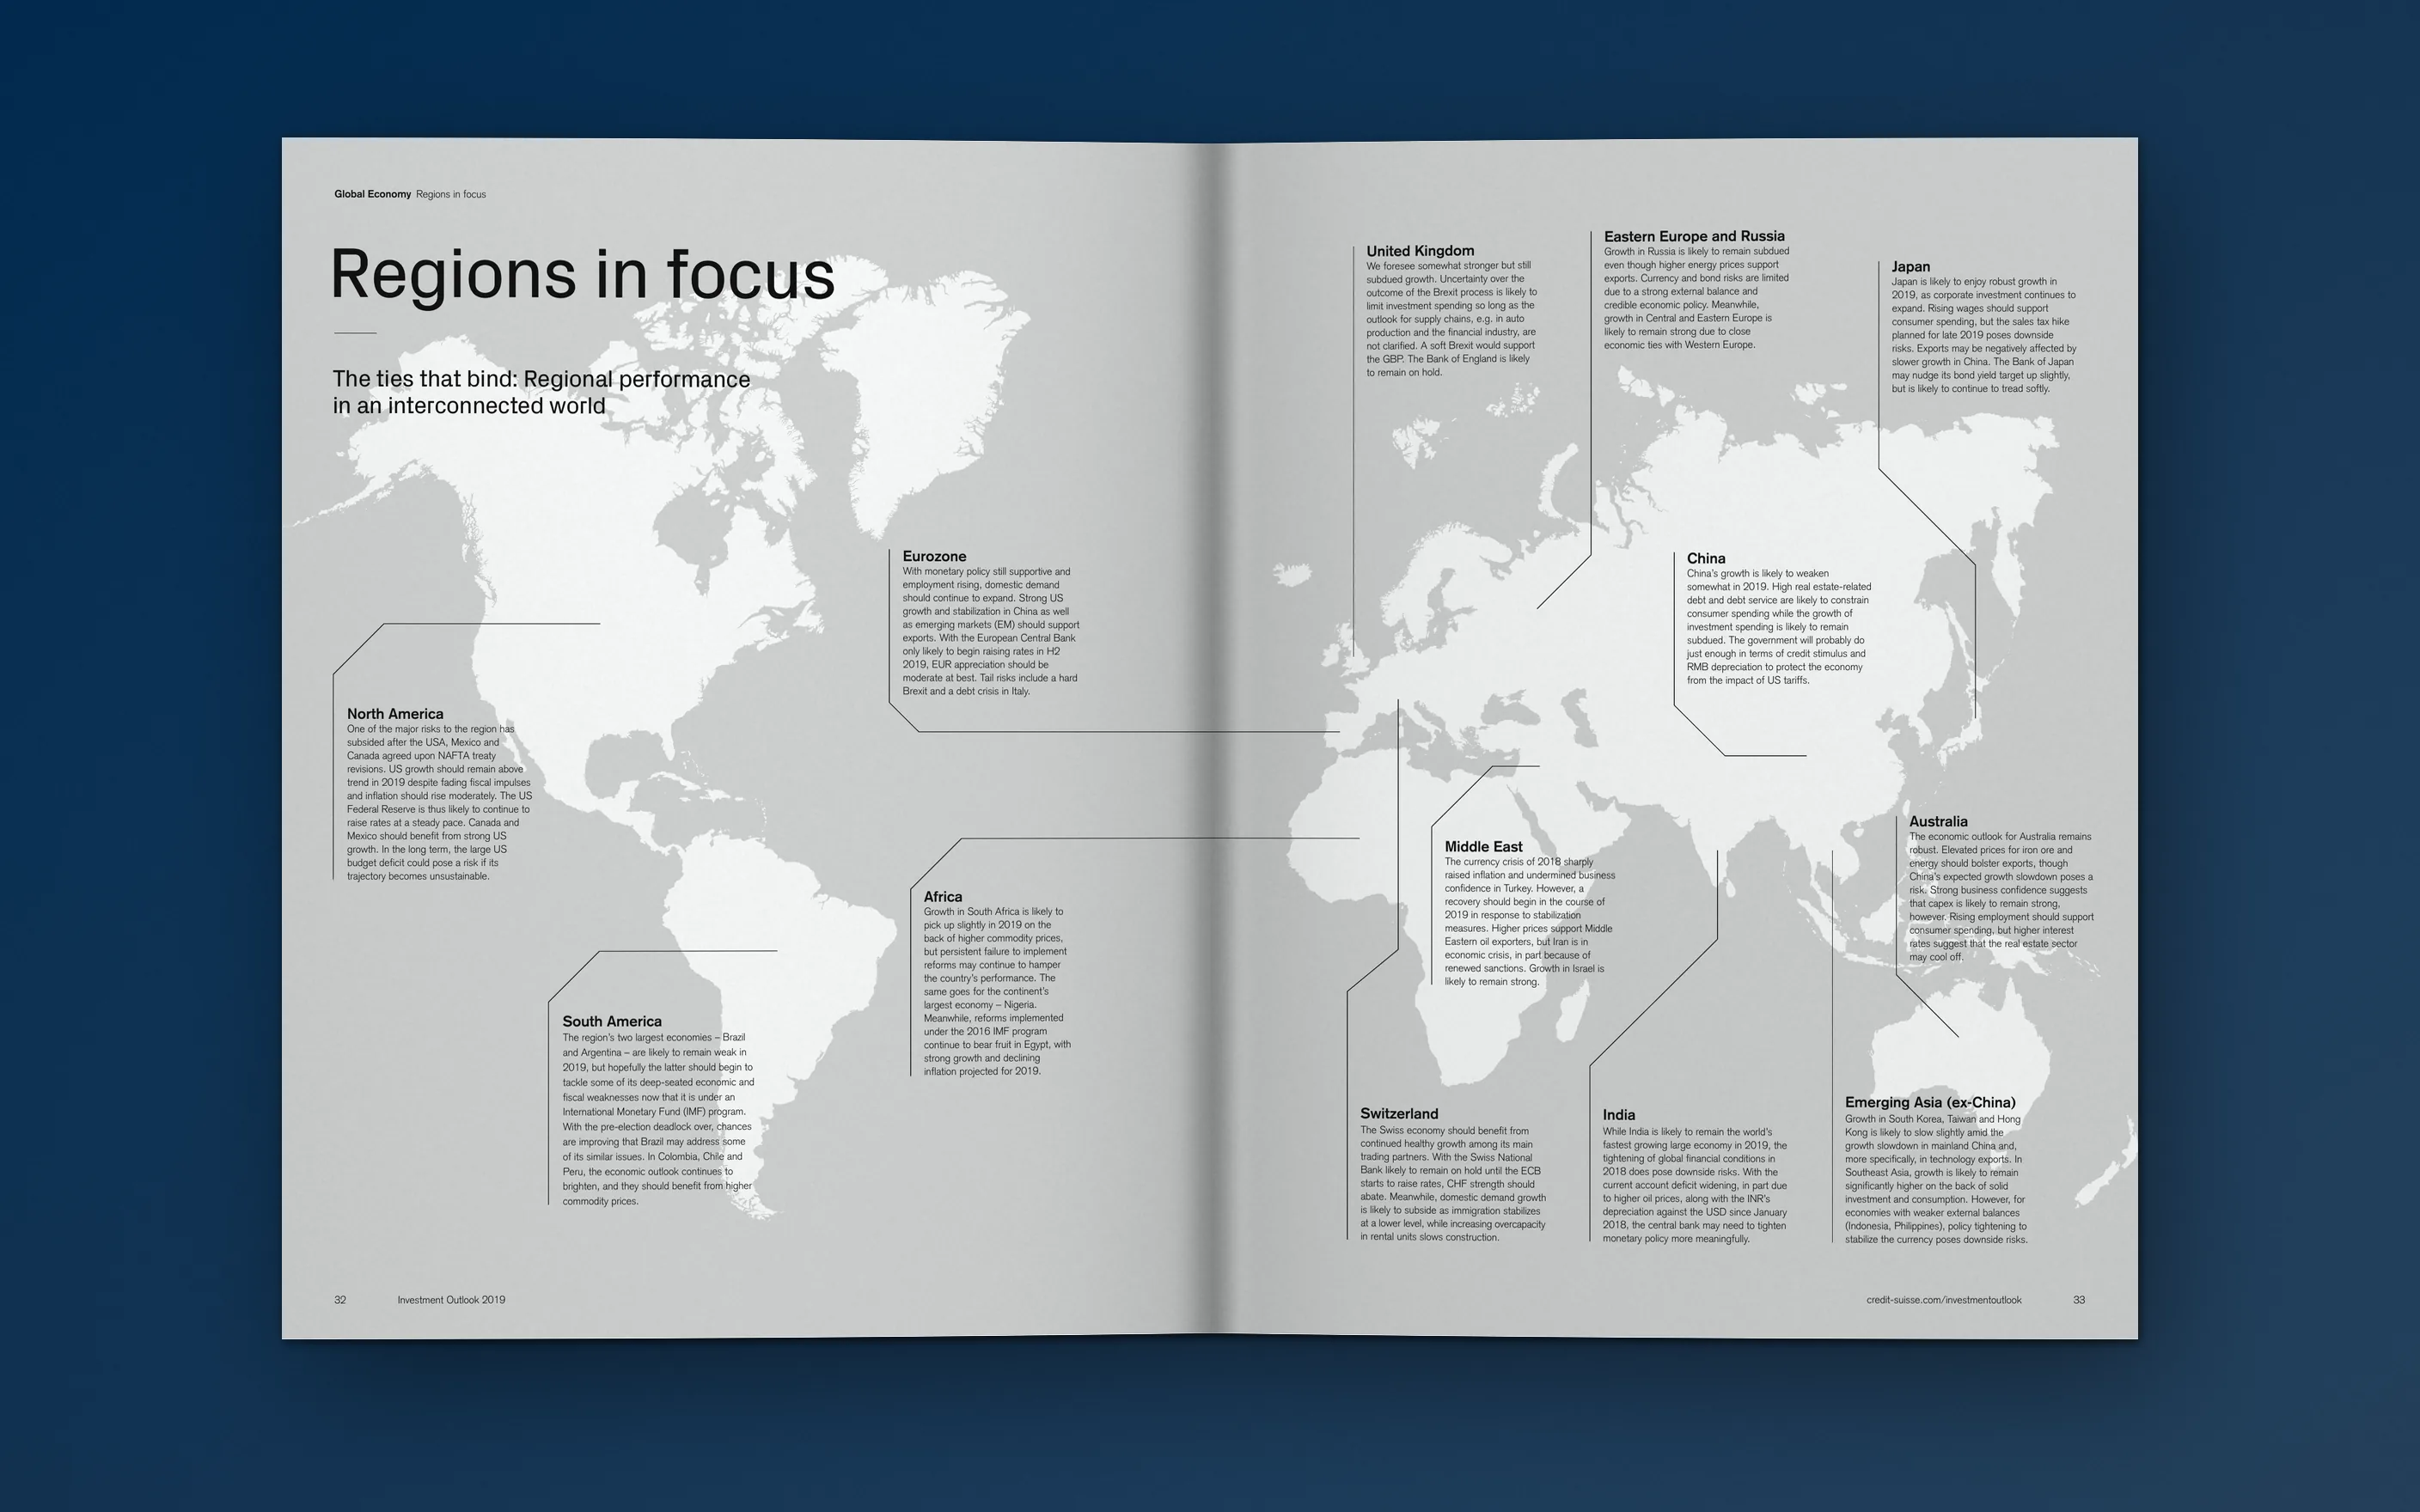
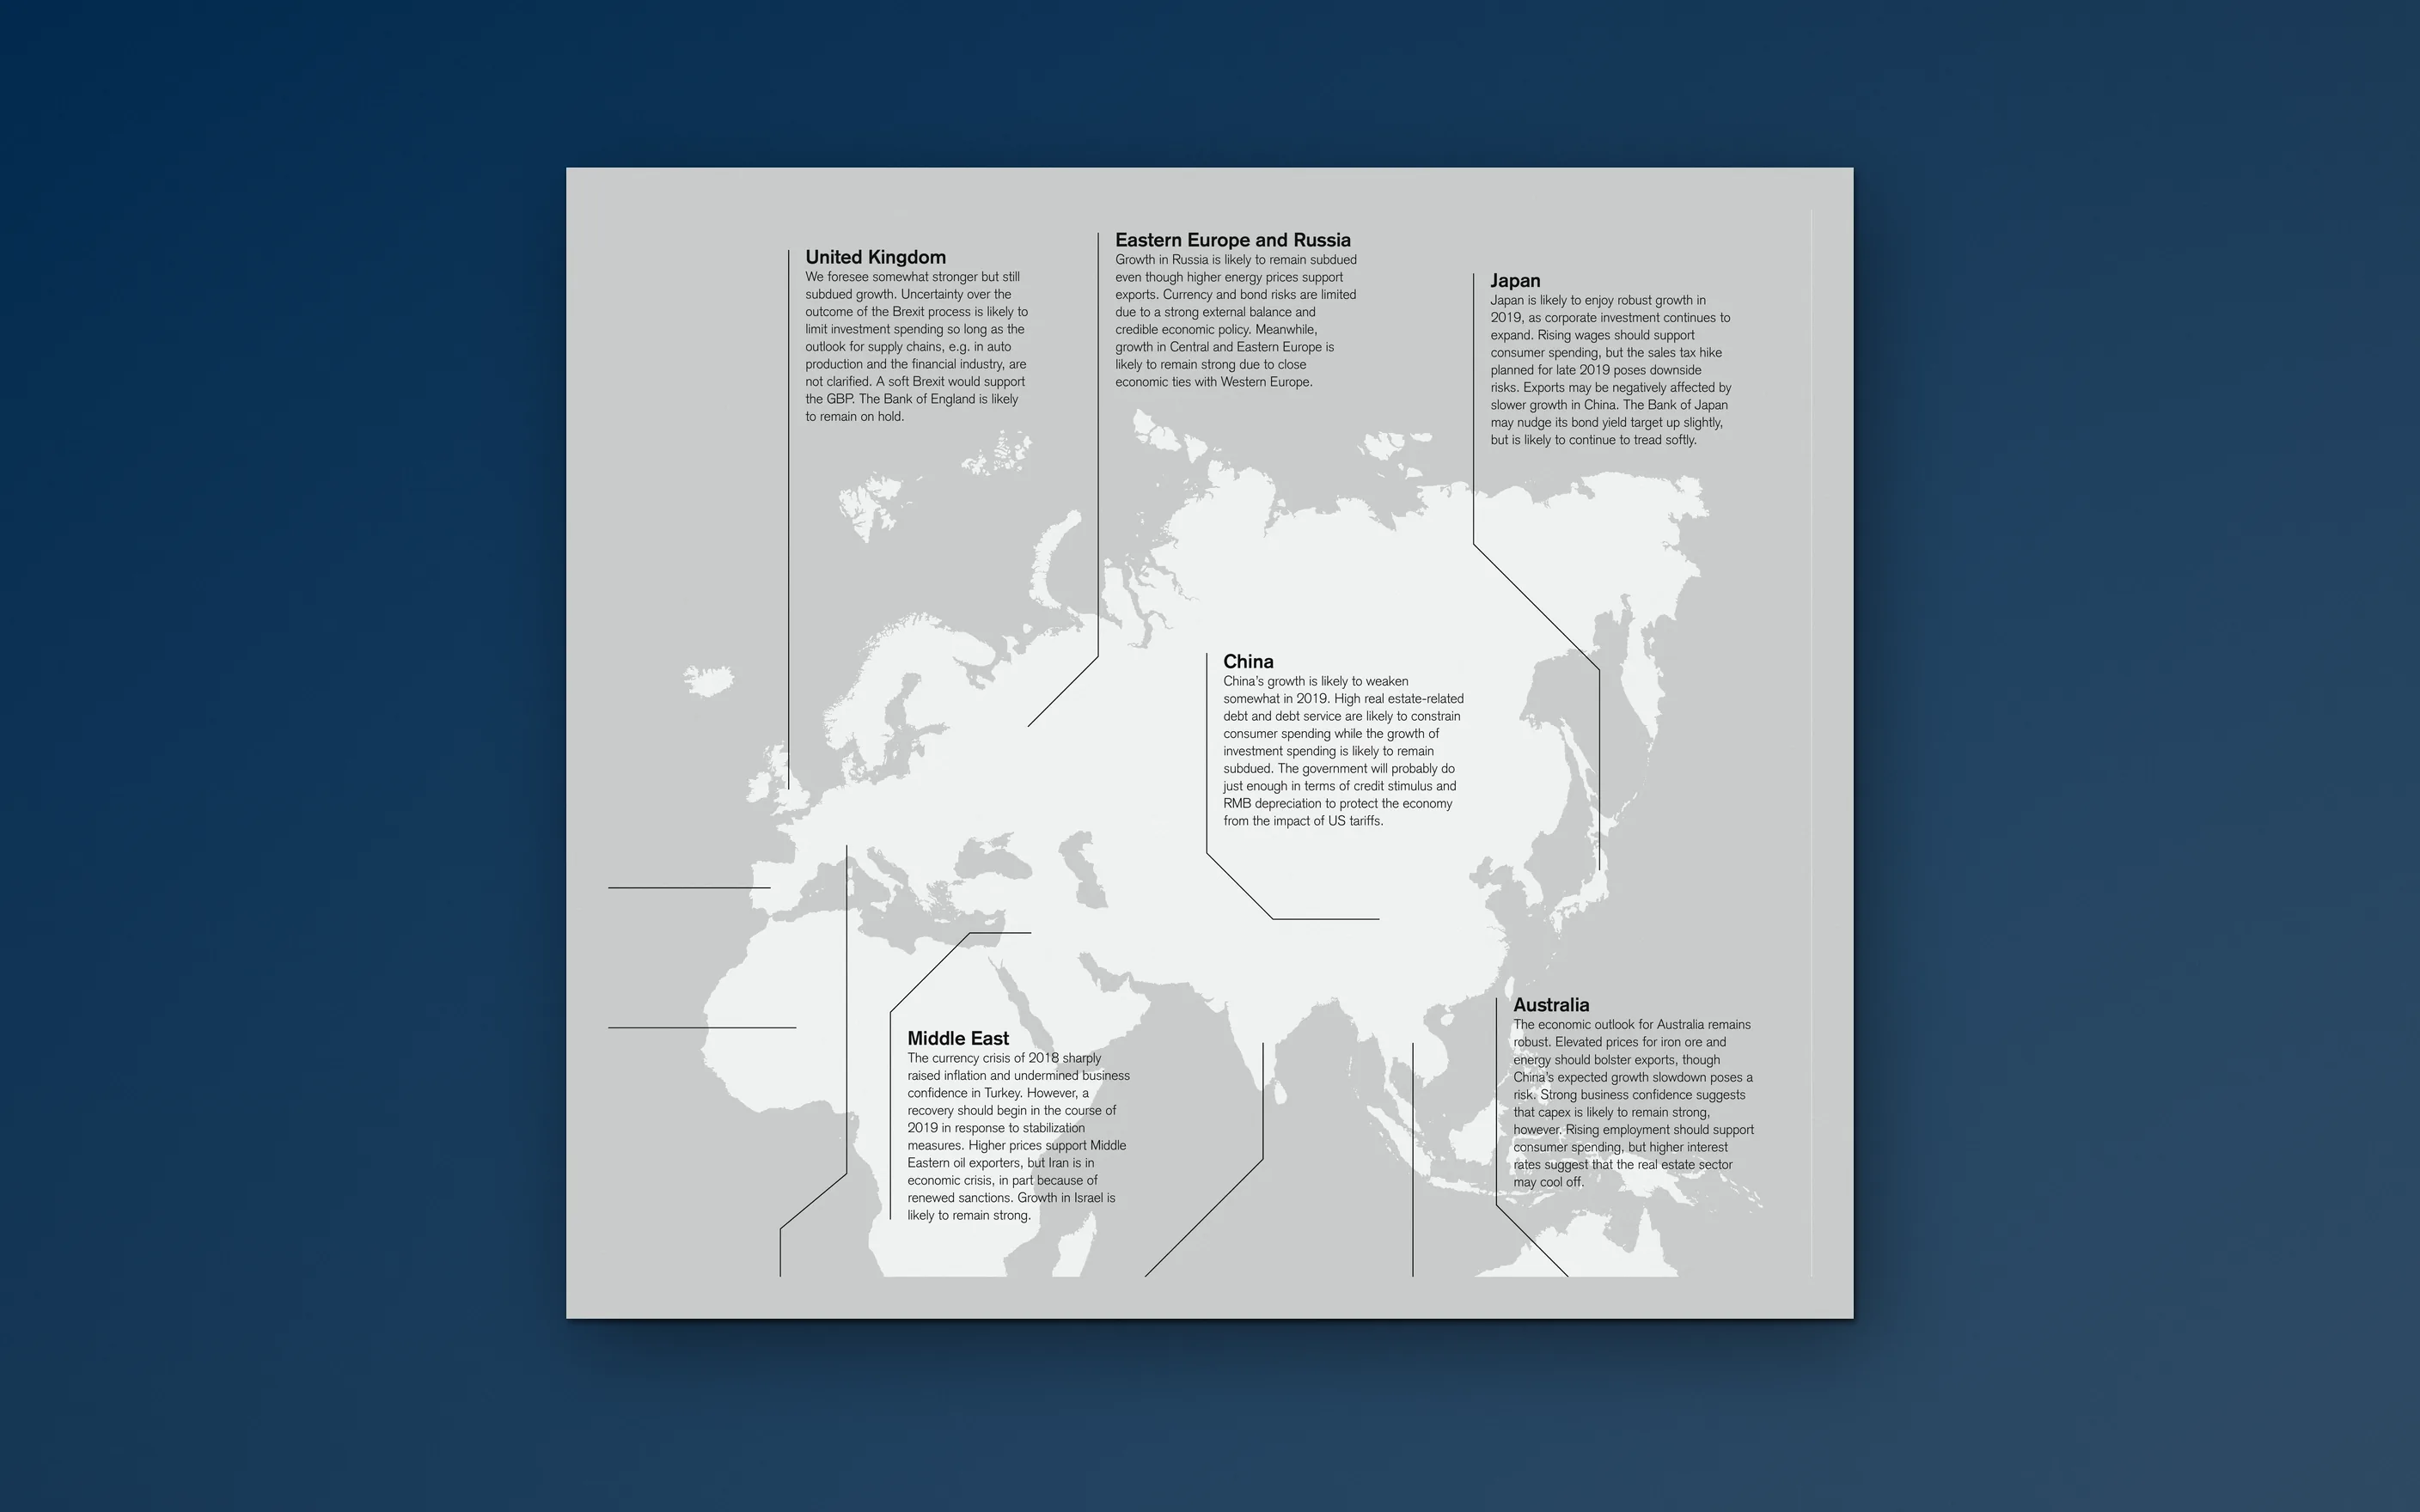
A world map spread brings the regional outlook together, from North America and the Eurozone to China, India, Africa and South America. Short forecasts sit close to their region, so readers can compare economies in one view instead of paging back and forth between separate chapters.
Precision for print
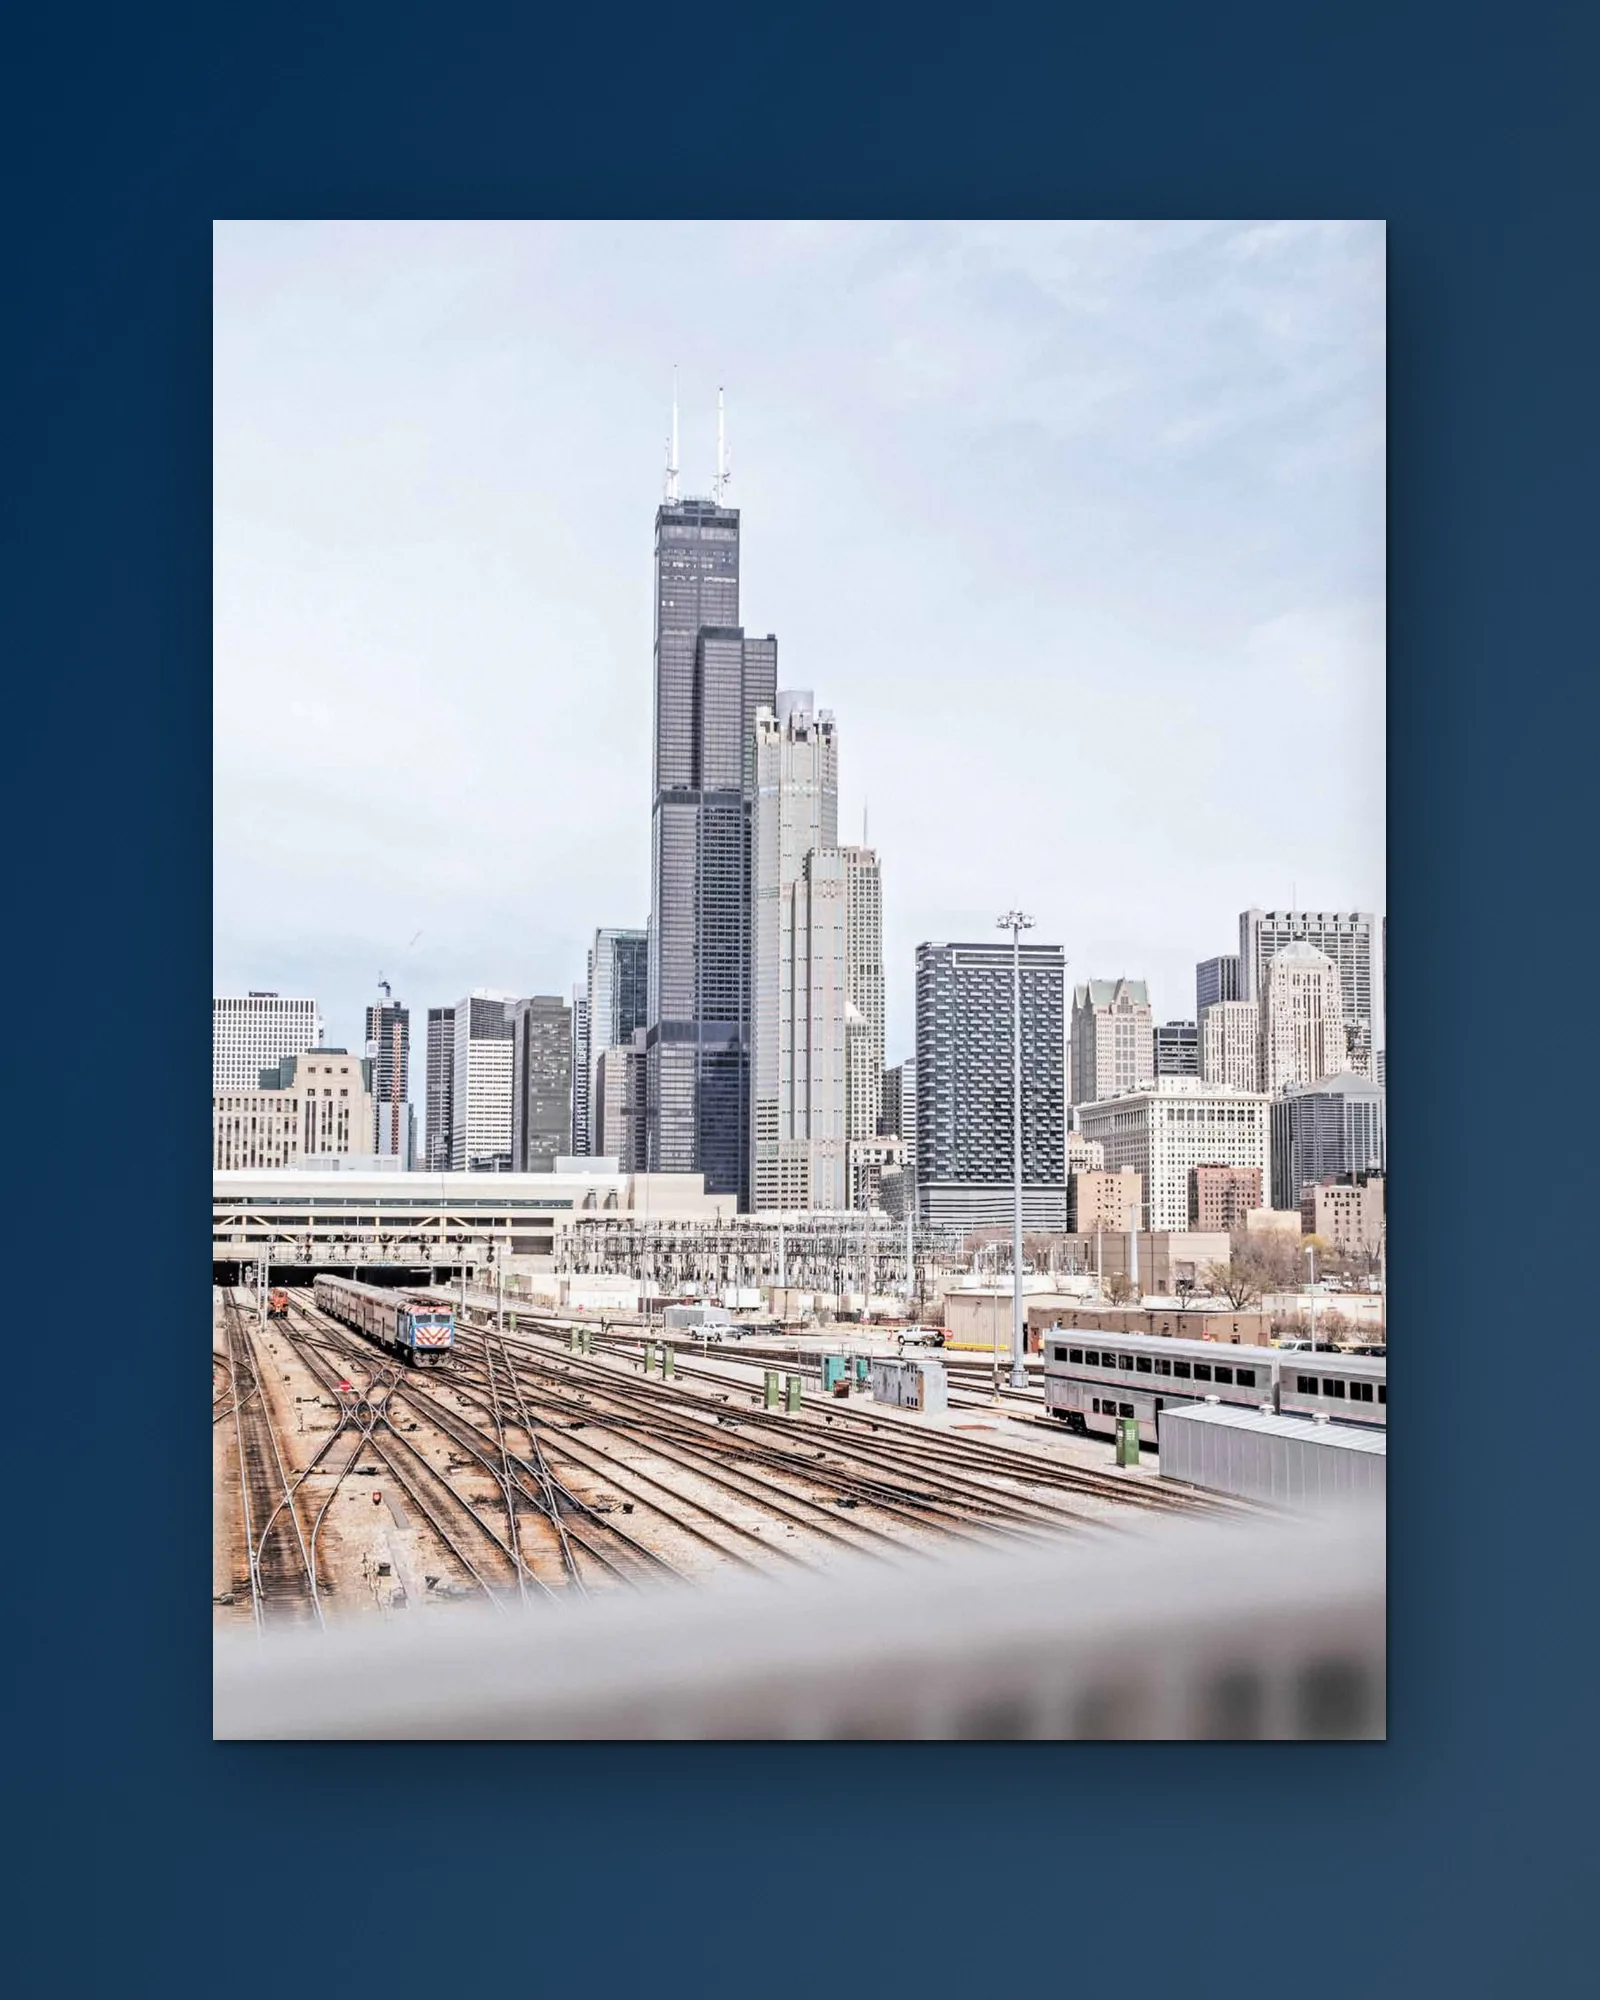
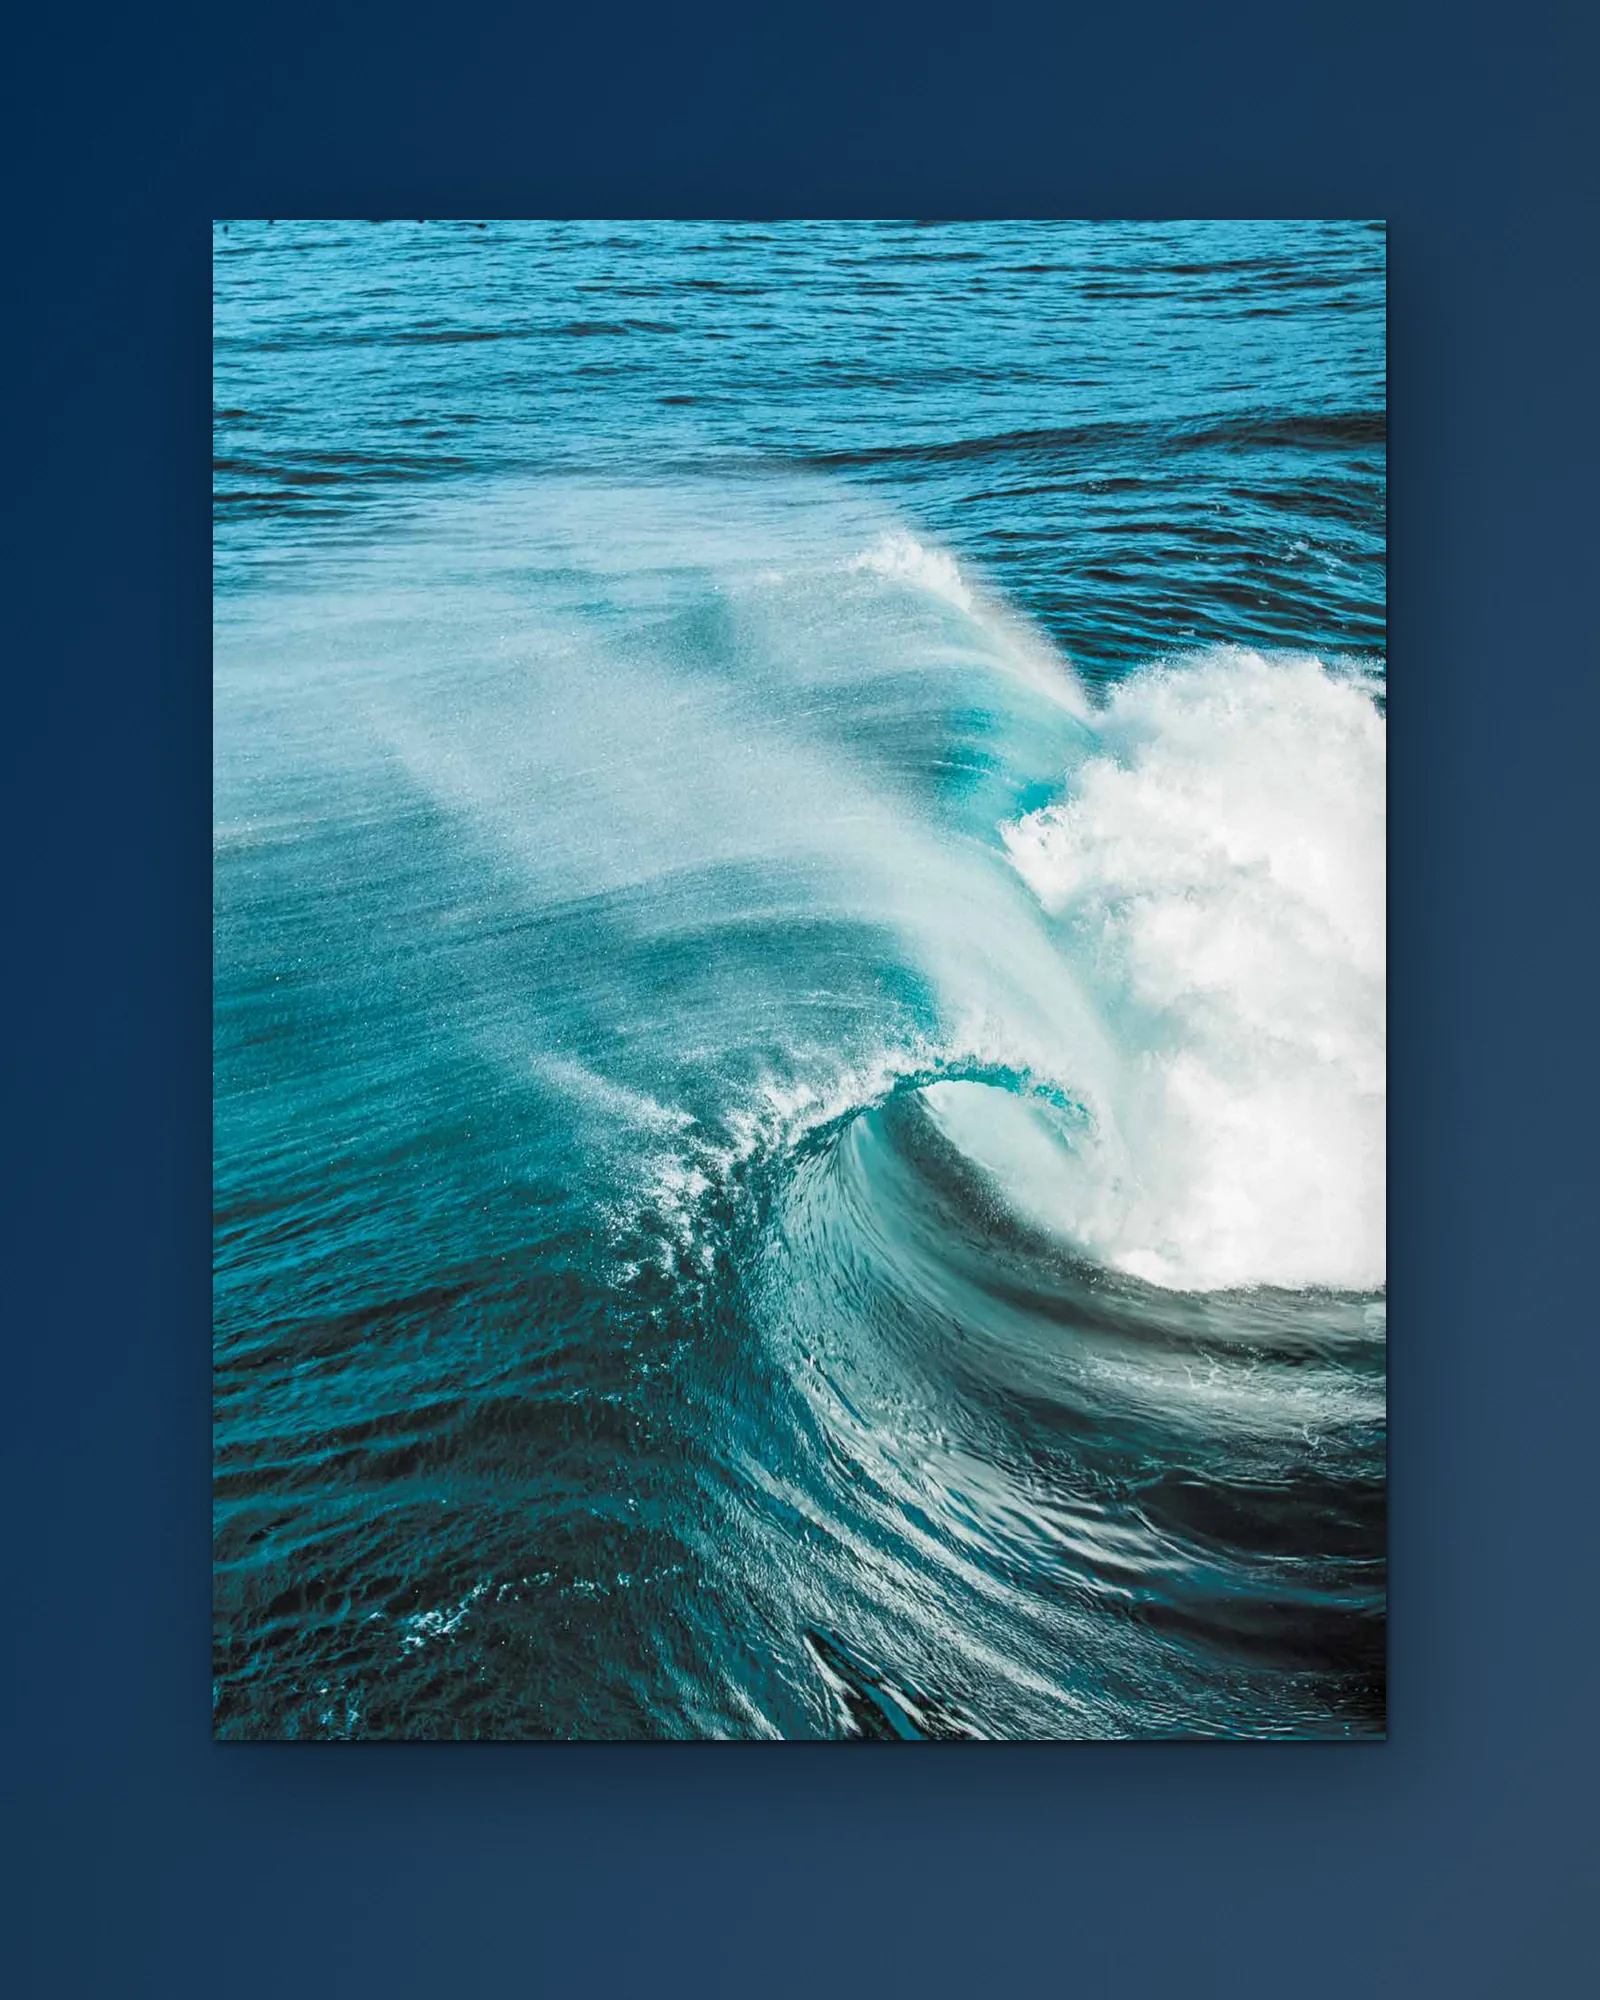
I edited the stock photography for the chapter and article openers and optimised colour, contrast and detail for print. Every spread went through careful prepress checks before the files went to the printer. The goal was imagery that feels quiet and atmospheric, sits naturally next to the data pages and stays true to the Credit Suisse palette.
From draft to deadline
As project manager I coordinated correction rounds for copy and charts between the Credit Suisse editorial team and the studio, right up to the editorial deadline of 9 November 2018. Keeping text, data and layout in sync across 66 pages was as much a part of the job as the design itself.
My contribution
- Took over as lead designer and project manager for the 2019 edition
- Designed the layout of all 66 pages on a strict grid, with recurring Spotlight pages and pull quotes
- Built 23 charts, tables and infographics as one consistent system
- Edited the stock photography for the openers and optimised it for print
- Coordinated the correction rounds for copy and charts up to the deadline
As lead designer and project manager at LINE Communications in Zurich, I worked with the Credit Suisse editorial team on copy, charts and corrections.